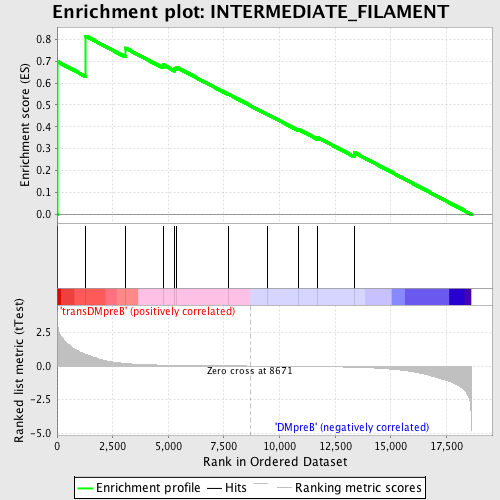
Profile of the Running ES Score & Positions of GeneSet Members on the Rank Ordered List
| Dataset | Set_04_transDMpreB_versus_DMpreB.phenotype_transDMpreB_versus_DMpreB.cls #transDMpreB_versus_DMpreB.phenotype_transDMpreB_versus_DMpreB.cls #transDMpreB_versus_DMpreB_repos |
| Phenotype | phenotype_transDMpreB_versus_DMpreB.cls#transDMpreB_versus_DMpreB_repos |
| Upregulated in class | transDMpreB |
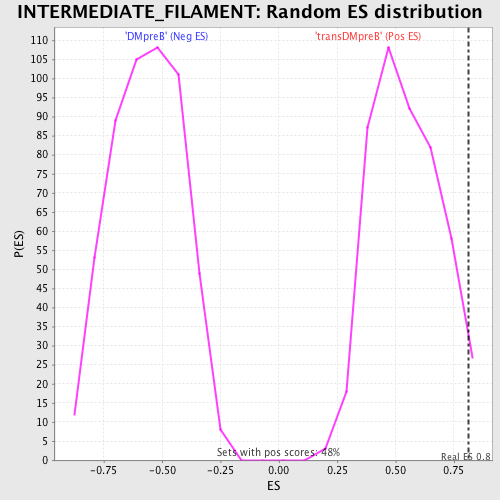
| GeneSet | INTERMEDIATE_FILAMENT |
| Enrichment Score (ES) | 0.81460273 |
| Normalized Enrichment Score (NES) | 1.4926192 |
| Nominal p-value | 0.029473685 |
| FDR q-value | 0.80138516 |
| FWER p-Value | 1.0 |
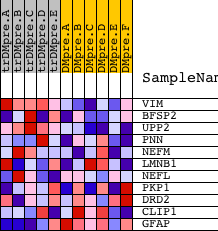
| PROBE | DESCRIPTION (from dataset) | GENE SYMBOL | GENE_TITLE | RANK IN GENE LIST | RANK METRIC SCORE | RUNNING ES | CORE ENRICHMENT | |
|---|---|---|---|---|---|---|---|---|
| 1 | VIM | 80 | 14 | 3.258 | 0.6980 | Yes | ||
| 2 | BFSP2 | 8420 | 1291 | 0.863 | 0.8146 | Yes | ||
| 3 | UPP2 | 15009 13346 8032 | 3066 | 0.191 | 0.7603 | No | ||
| 4 | PNN | 9596 | 4764 | 0.066 | 0.6833 | No | ||
| 5 | NEFM | 5171 | 5292 | 0.051 | 0.6659 | No | ||
| 6 | LMNB1 | 23549 1943 | 5364 | 0.049 | 0.6727 | No | ||
| 7 | NEFL | 9459 | 7706 | 0.011 | 0.5492 | No | ||
| 8 | PKP1 | 13821 | 9440 | -0.010 | 0.4581 | No | ||
| 9 | DRD2 | 19461 | 10850 | -0.029 | 0.3885 | No | ||
| 10 | CLIP1 | 3603 7121 | 11715 | -0.043 | 0.3513 | No | ||
| 11 | GFAP | 4774 | 13350 | -0.091 | 0.2830 | No |