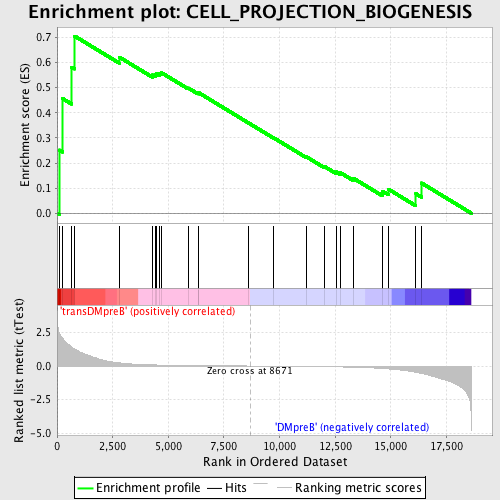
Profile of the Running ES Score & Positions of GeneSet Members on the Rank Ordered List
| Dataset | Set_04_transDMpreB_versus_DMpreB.phenotype_transDMpreB_versus_DMpreB.cls #transDMpreB_versus_DMpreB.phenotype_transDMpreB_versus_DMpreB.cls #transDMpreB_versus_DMpreB_repos |
| Phenotype | phenotype_transDMpreB_versus_DMpreB.cls#transDMpreB_versus_DMpreB_repos |
| Upregulated in class | transDMpreB |
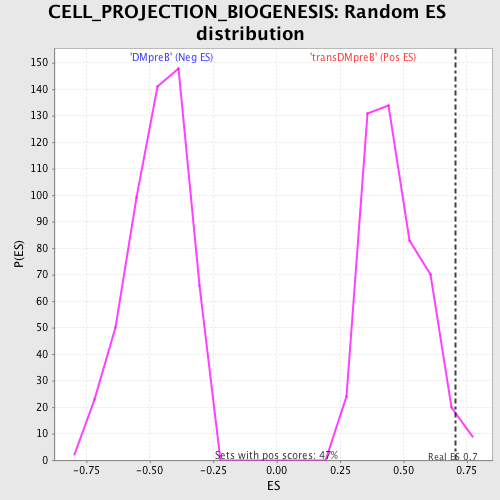
| GeneSet | CELL_PROJECTION_BIOGENESIS |
| Enrichment Score (ES) | 0.7053583 |
| Normalized Enrichment Score (NES) | 1.5161232 |
| Nominal p-value | 0.027600849 |
| FDR q-value | 1.0 |
| FWER p-Value | 1.0 |
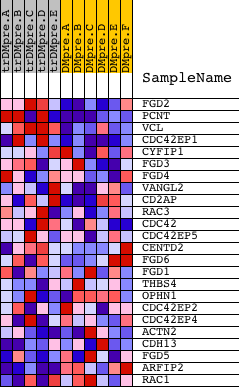
| PROBE | DESCRIPTION (from dataset) | GENE SYMBOL | GENE_TITLE | RANK IN GENE LIST | RANK METRIC SCORE | RUNNING ES | CORE ENRICHMENT | |
|---|---|---|---|---|---|---|---|---|
| 1 | FGD2 | 23309 | 94 | 2.487 | 0.2518 | Yes | ||
| 2 | PCNT | 19724 | 248 | 2.061 | 0.4565 | Yes | ||
| 3 | VCL | 22083 | 654 | 1.422 | 0.5816 | Yes | ||
| 4 | CDC42EP1 | 22433 10435 13411 11239 | 790 | 1.268 | 0.7054 | Yes | ||
| 5 | CYFIP1 | 9814 | 2792 | 0.234 | 0.6219 | No | ||
| 6 | FGD3 | 11399 | 4280 | 0.085 | 0.5507 | No | ||
| 7 | FGD4 | 10306 5870 1717 1669 1700 | 4414 | 0.080 | 0.5518 | No | ||
| 8 | VANGL2 | 4109 8220 | 4477 | 0.077 | 0.5564 | No | ||
| 9 | CD2AP | 22975 | 4610 | 0.072 | 0.5567 | No | ||
| 10 | RAC3 | 20561 | 4683 | 0.069 | 0.5600 | No | ||
| 11 | CDC42 | 4503 8722 4504 2465 | 5895 | 0.038 | 0.4988 | No | ||
| 12 | CDC42EP5 | 17991 | 6342 | 0.030 | 0.4779 | No | ||
| 13 | CENTD2 | 1758 18169 2284 | 6373 | 0.030 | 0.4794 | No | ||
| 14 | FGD6 | 19901 | 8581 | 0.001 | 0.3608 | No | ||
| 15 | FGD1 | 24228 | 9726 | -0.013 | 0.3006 | No | ||
| 16 | THBS4 | 21393 | 11206 | -0.034 | 0.2246 | No | ||
| 17 | OPHN1 | 24102 | 12002 | -0.049 | 0.1869 | No | ||
| 18 | CDC42EP2 | 4180 14771 | 12539 | -0.063 | 0.1645 | No | ||
| 19 | CDC42EP4 | 20163 | 12734 | -0.069 | 0.1612 | No | ||
| 20 | ACTN2 | 21545 | 13310 | -0.090 | 0.1396 | No | ||
| 21 | CDH13 | 4506 3826 | 14630 | -0.183 | 0.0875 | No | ||
| 22 | FGD5 | 10555 17352 | 14894 | -0.215 | 0.0956 | No | ||
| 23 | ARFIP2 | 1226 17702 | 16125 | -0.465 | 0.0774 | No | ||
| 24 | RAC1 | 16302 | 16377 | -0.547 | 0.1204 | No |