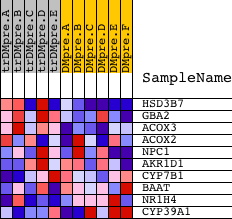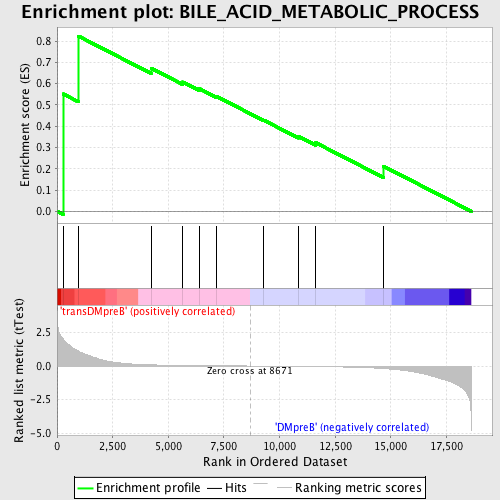
Profile of the Running ES Score & Positions of GeneSet Members on the Rank Ordered List
| Dataset | Set_04_transDMpreB_versus_DMpreB.phenotype_transDMpreB_versus_DMpreB.cls #transDMpreB_versus_DMpreB.phenotype_transDMpreB_versus_DMpreB.cls #transDMpreB_versus_DMpreB_repos |
| Phenotype | phenotype_transDMpreB_versus_DMpreB.cls#transDMpreB_versus_DMpreB_repos |
| Upregulated in class | transDMpreB |
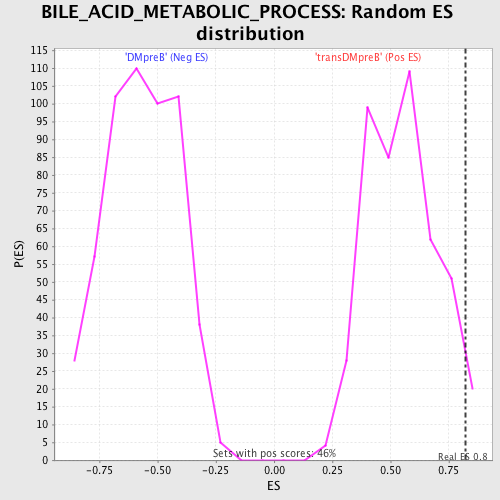
| GeneSet | BILE_ACID_METABOLIC_PROCESS |
| Enrichment Score (ES) | 0.82359535 |
| Normalized Enrichment Score (NES) | 1.5013685 |
| Nominal p-value | 0.02183406 |
| FDR q-value | 0.84397286 |
| FWER p-Value | 1.0 |
| PROBE | DESCRIPTION (from dataset) | GENE SYMBOL | GENE_TITLE | RANK IN GENE LIST | RANK METRIC SCORE | RUNNING ES | CORE ENRICHMENT | |
|---|---|---|---|---|---|---|---|---|
| 1 | HSD3B7 | 4158 | 272 | 2.007 | 0.5518 | Yes | ||
| 2 | GBA2 | 15898 | 957 | 1.094 | 0.8236 | Yes | ||
| 3 | ACOX3 | 3612 16867 | 4230 | 0.088 | 0.6725 | No | ||
| 4 | ACOX2 | 21924 | 5654 | 0.043 | 0.6080 | No | ||
| 5 | NPC1 | 5187 | 6390 | 0.030 | 0.5769 | No | ||
| 6 | AKR1D1 | 17483 | 7170 | 0.018 | 0.5400 | No | ||
| 7 | CYP7B1 | 15373 | 9279 | -0.007 | 0.4289 | No | ||
| 8 | BAAT | 15885 | 10847 | -0.029 | 0.3527 | No | ||
| 9 | NR1H4 | 19648 | 11628 | -0.041 | 0.3224 | No | ||
| 10 | CYP39A1 | 1538 23232 | 14675 | -0.188 | 0.2118 | No |