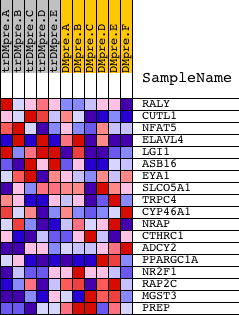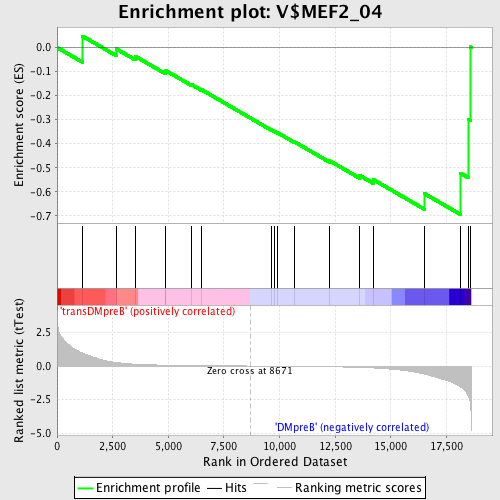
Profile of the Running ES Score & Positions of GeneSet Members on the Rank Ordered List
| Dataset | Set_04_transDMpreB_versus_DMpreB.phenotype_transDMpreB_versus_DMpreB.cls #transDMpreB_versus_DMpreB.phenotype_transDMpreB_versus_DMpreB.cls #transDMpreB_versus_DMpreB_repos |
| Phenotype | phenotype_transDMpreB_versus_DMpreB.cls#transDMpreB_versus_DMpreB_repos |
| Upregulated in class | DMpreB |
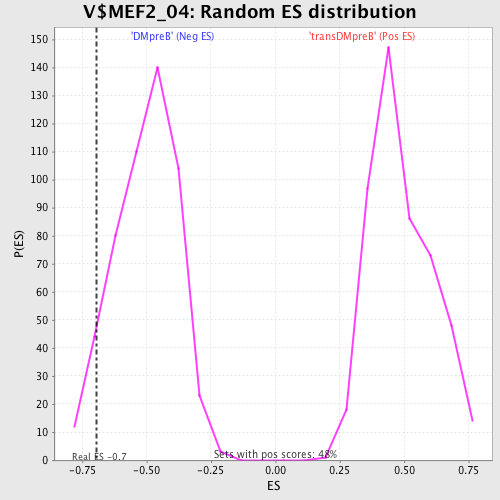
| GeneSet | V$MEF2_04 |
| Enrichment Score (ES) | -0.69420475 |
| Normalized Enrichment Score (NES) | -1.3827554 |
| Nominal p-value | 0.058139537 |
| FDR q-value | 1.0 |
| FWER p-Value | 1.0 |
| PROBE | DESCRIPTION (from dataset) | GENE SYMBOL | GENE_TITLE | RANK IN GENE LIST | RANK METRIC SCORE | RUNNING ES | CORE ENRICHMENT | |
|---|---|---|---|---|---|---|---|---|
| 1 | RALY | 2718 9690 | 1143 | 0.979 | 0.0472 | No | ||
| 2 | CUTL1 | 3507 3480 8820 3609 4577 | 2665 | 0.257 | -0.0060 | No | ||
| 3 | NFAT5 | 3921 7037 12036 | 3519 | 0.137 | -0.0367 | No | ||
| 4 | ELAVL4 | 15805 4889 9137 | 4859 | 0.063 | -0.1016 | No | ||
| 5 | LGI1 | 23867 | 4891 | 0.062 | -0.0964 | No | ||
| 6 | ASB16 | 20644 | 6031 | 0.035 | -0.1537 | No | ||
| 7 | EYA1 | 4695 4061 | 6495 | 0.028 | -0.1755 | No | ||
| 8 | SLCO5A1 | 6286 | 9631 | -0.012 | -0.3427 | No | ||
| 9 | TRPC4 | 15593 | 9756 | -0.014 | -0.3478 | No | ||
| 10 | CYP46A1 | 21158 | 9922 | -0.016 | -0.3549 | No | ||
| 11 | NRAP | 23642 | 10671 | -0.026 | -0.3923 | No | ||
| 12 | CTHRC1 | 22485 | 12264 | -0.055 | -0.4717 | No | ||
| 13 | ADCY2 | 21412 | 13602 | -0.104 | -0.5320 | No | ||
| 14 | PPARGC1A | 16533 | 14203 | -0.142 | -0.5485 | No | ||
| 15 | NR2F1 | 7015 21401 | 16502 | -0.589 | -0.6067 | Yes | ||
| 16 | RAP2C | 24156 | 18131 | -1.543 | -0.5229 | Yes | ||
| 17 | MGST3 | 13771 12349 | 18471 | -2.184 | -0.2985 | Yes | ||
| 18 | PREP | 20035 | 18572 | -2.757 | 0.0024 | Yes |