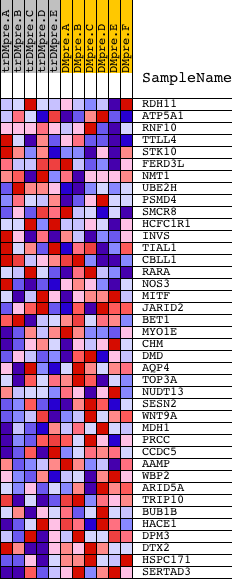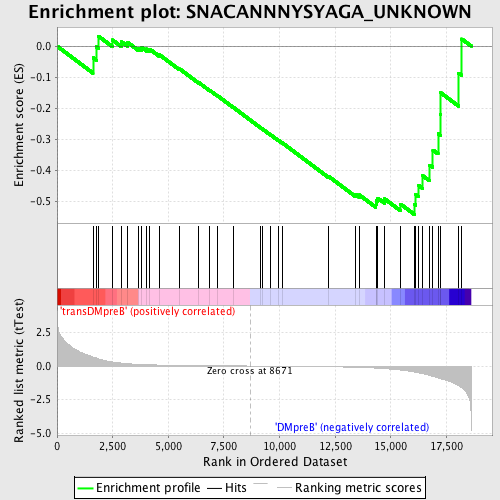
Profile of the Running ES Score & Positions of GeneSet Members on the Rank Ordered List
| Dataset | Set_04_transDMpreB_versus_DMpreB.phenotype_transDMpreB_versus_DMpreB.cls #transDMpreB_versus_DMpreB.phenotype_transDMpreB_versus_DMpreB.cls #transDMpreB_versus_DMpreB_repos |
| Phenotype | phenotype_transDMpreB_versus_DMpreB.cls#transDMpreB_versus_DMpreB_repos |
| Upregulated in class | DMpreB |
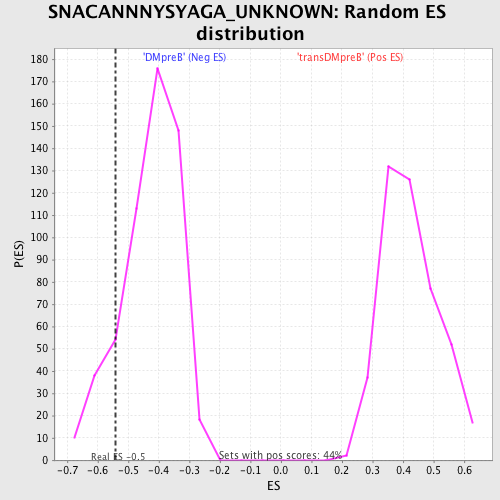
| GeneSet | SNACANNNYSYAGA_UNKNOWN |
| Enrichment Score (ES) | -0.54188436 |
| Normalized Enrichment Score (NES) | -1.2676189 |
| Nominal p-value | 0.120287254 |
| FDR q-value | 1.0 |
| FWER p-Value | 1.0 |
| PROBE | DESCRIPTION (from dataset) | GENE SYMBOL | GENE_TITLE | RANK IN GENE LIST | RANK METRIC SCORE | RUNNING ES | CORE ENRICHMENT | |
|---|---|---|---|---|---|---|---|---|
| 1 | RDH11 | 21031 | 1614 | 0.673 | -0.0376 | No | ||
| 2 | ATP5A1 | 23505 | 1763 | 0.591 | -0.0022 | No | ||
| 3 | RNF10 | 16411 | 1855 | 0.537 | 0.0323 | No | ||
| 4 | TTLL4 | 328 | 2487 | 0.297 | 0.0201 | No | ||
| 5 | STK10 | 5532 9916 | 2897 | 0.217 | 0.0139 | No | ||
| 6 | FERD3L | 21292 | 3176 | 0.175 | 0.0118 | No | ||
| 7 | NMT1 | 20638 | 3676 | 0.124 | -0.0060 | No | ||
| 8 | UBE2H | 5823 5822 | 3809 | 0.114 | -0.0048 | No | ||
| 9 | PSMD4 | 15251 | 4024 | 0.100 | -0.0089 | No | ||
| 10 | SMCR8 | 53 | 4168 | 0.091 | -0.0099 | No | ||
| 11 | HCFC1R1 | 23367 | 4589 | 0.072 | -0.0272 | No | ||
| 12 | INVS | 2397 16211 | 5508 | 0.046 | -0.0733 | No | ||
| 13 | TIAL1 | 996 5753 | 6360 | 0.030 | -0.1169 | No | ||
| 14 | CBLL1 | 4188 | 6861 | 0.022 | -0.1422 | No | ||
| 15 | RARA | 5358 | 7194 | 0.018 | -0.1588 | No | ||
| 16 | NOS3 | 16906 885 | 7918 | 0.009 | -0.1971 | No | ||
| 17 | MITF | 17349 | 9128 | -0.005 | -0.2617 | No | ||
| 18 | JARID2 | 9200 | 9218 | -0.007 | -0.2661 | No | ||
| 19 | BET1 | 17226 | 9572 | -0.011 | -0.2842 | No | ||
| 20 | MYO1E | 7742 | 9957 | -0.016 | -0.3037 | No | ||
| 21 | CHM | 4521 | 10116 | -0.018 | -0.3109 | No | ||
| 22 | DMD | 24295 2647 | 12193 | -0.054 | -0.4187 | No | ||
| 23 | AQP4 | 4403 | 13416 | -0.095 | -0.4775 | No | ||
| 24 | TOP3A | 5792 | 13581 | -0.103 | -0.4788 | No | ||
| 25 | NUDT13 | 22088 | 14333 | -0.152 | -0.5081 | No | ||
| 26 | SESN2 | 15733 | 14349 | -0.154 | -0.4976 | No | ||
| 27 | WNT9A | 5709 | 14415 | -0.162 | -0.4892 | No | ||
| 28 | MDH1 | 1245 9400 | 14722 | -0.193 | -0.4916 | No | ||
| 29 | PRCC | 15298 1924 | 15436 | -0.295 | -0.5083 | No | ||
| 30 | CCDC5 | 23404 | 16060 | -0.447 | -0.5091 | Yes | ||
| 31 | AAMP | 10406 | 16120 | -0.463 | -0.4783 | Yes | ||
| 32 | WBP2 | 20146 | 16255 | -0.501 | -0.4489 | Yes | ||
| 33 | ARID5A | 5668 | 16436 | -0.562 | -0.4173 | Yes | ||
| 34 | TRIP10 | 23174 | 16748 | -0.697 | -0.3829 | Yes | ||
| 35 | BUB1B | 14908 | 16892 | -0.766 | -0.3345 | Yes | ||
| 36 | HACE1 | 20034 | 17125 | -0.888 | -0.2818 | Yes | ||
| 37 | DPM3 | 15540 | 17228 | -0.936 | -0.2187 | Yes | ||
| 38 | DTX2 | 16674 3488 | 17246 | -0.947 | -0.1502 | Yes | ||
| 39 | HSPC171 | 18494 | 18047 | -1.450 | -0.0870 | Yes | ||
| 40 | SERTAD3 | 18327 | 18188 | -1.603 | 0.0230 | Yes |