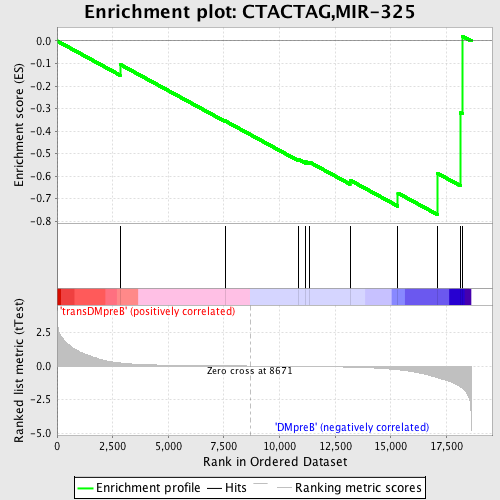
Profile of the Running ES Score & Positions of GeneSet Members on the Rank Ordered List
| Dataset | Set_04_transDMpreB_versus_DMpreB.phenotype_transDMpreB_versus_DMpreB.cls #transDMpreB_versus_DMpreB.phenotype_transDMpreB_versus_DMpreB.cls #transDMpreB_versus_DMpreB_repos |
| Phenotype | phenotype_transDMpreB_versus_DMpreB.cls#transDMpreB_versus_DMpreB_repos |
| Upregulated in class | DMpreB |
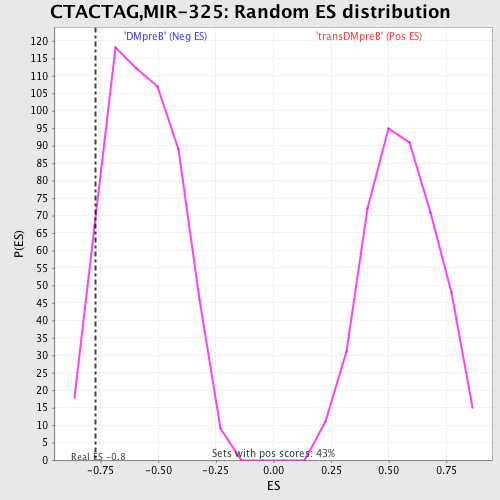
| GeneSet | CTACTAG,MIR-325 |
| Enrichment Score (ES) | -0.7705406 |
| Normalized Enrichment Score (NES) | -1.3527545 |
| Nominal p-value | 0.07597173 |
| FDR q-value | 1.0 |
| FWER p-Value | 1.0 |
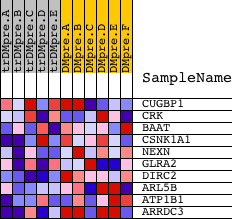
| PROBE | DESCRIPTION (from dataset) | GENE SYMBOL | GENE_TITLE | RANK IN GENE LIST | RANK METRIC SCORE | RUNNING ES | CORE ENRICHMENT | |
|---|---|---|---|---|---|---|---|---|
| 1 | CUGBP1 | 2805 8819 4576 2924 | 2834 | 0.228 | -0.1043 | No | ||
| 2 | CRK | 4559 1249 | 7549 | 0.013 | -0.3549 | No | ||
| 3 | BAAT | 15885 | 10847 | -0.029 | -0.5260 | No | ||
| 4 | CSNK1A1 | 8204 | 11168 | -0.034 | -0.5362 | No | ||
| 5 | NEXN | 12737 1903 | 11336 | -0.036 | -0.5376 | No | ||
| 6 | GLRA2 | 24008 | 13168 | -0.084 | -0.6182 | No | ||
| 7 | DIRC2 | 22603 | 15320 | -0.277 | -0.6756 | Yes | ||
| 8 | ARL5B | 15115 | 17087 | -0.872 | -0.5872 | Yes | ||
| 9 | ATP1B1 | 4420 | 18129 | -1.539 | -0.3194 | Yes | ||
| 10 | ARRDC3 | 4191 | 18215 | -1.643 | 0.0216 | Yes |