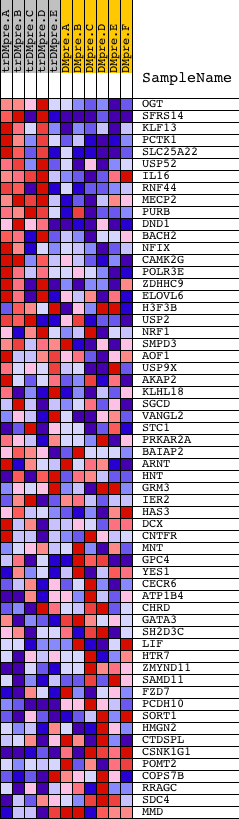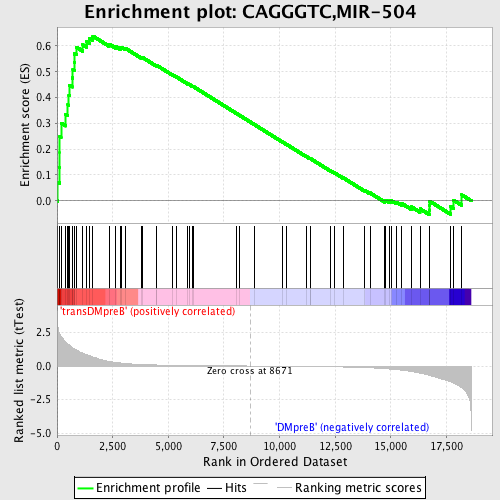
Profile of the Running ES Score & Positions of GeneSet Members on the Rank Ordered List
| Dataset | Set_04_transDMpreB_versus_DMpreB.phenotype_transDMpreB_versus_DMpreB.cls #transDMpreB_versus_DMpreB.phenotype_transDMpreB_versus_DMpreB.cls #transDMpreB_versus_DMpreB_repos |
| Phenotype | phenotype_transDMpreB_versus_DMpreB.cls#transDMpreB_versus_DMpreB_repos |
| Upregulated in class | transDMpreB |
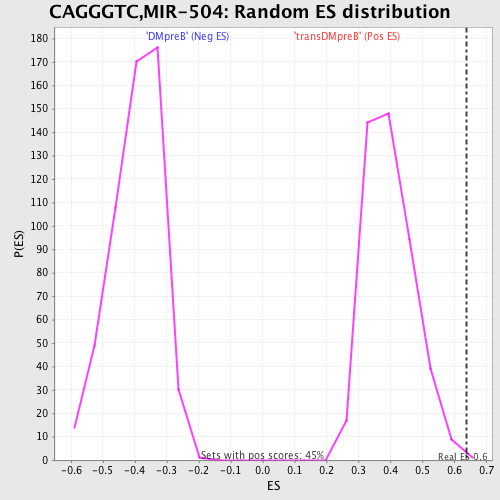
| GeneSet | CAGGGTC,MIR-504 |
| Enrichment Score (ES) | 0.63797516 |
| Normalized Enrichment Score (NES) | 1.6116625 |
| Nominal p-value | 0.0022123894 |
| FDR q-value | 0.25857833 |
| FWER p-Value | 0.335 |
| PROBE | DESCRIPTION (from dataset) | GENE SYMBOL | GENE_TITLE | RANK IN GENE LIST | RANK METRIC SCORE | RUNNING ES | CORE ENRICHMENT | |
|---|---|---|---|---|---|---|---|---|
| 1 | OGT | 4241 24274 | 32 | 2.930 | 0.0724 | Yes | ||
| 2 | SFRS14 | 10622 | 111 | 2.412 | 0.1293 | Yes | ||
| 3 | KLF13 | 17807 | 119 | 2.372 | 0.1889 | Yes | ||
| 4 | PCTK1 | 24369 | 122 | 2.344 | 0.2482 | Yes | ||
| 5 | SLC25A22 | 12671 | 177 | 2.205 | 0.3011 | Yes | ||
| 6 | USP52 | 3397 19841 | 387 | 1.783 | 0.3349 | Yes | ||
| 7 | IL16 | 9171 | 484 | 1.647 | 0.3714 | Yes | ||
| 8 | RNF44 | 8364 | 529 | 1.588 | 0.4093 | Yes | ||
| 9 | MECP2 | 5088 | 557 | 1.551 | 0.4471 | Yes | ||
| 10 | PURB | 5335 | 674 | 1.394 | 0.4761 | Yes | ||
| 11 | DND1 | 10017 | 710 | 1.349 | 0.5083 | Yes | ||
| 12 | BACH2 | 8648 | 769 | 1.283 | 0.5377 | Yes | ||
| 13 | NFIX | 9458 | 780 | 1.276 | 0.5695 | Yes | ||
| 14 | CAMK2G | 21905 | 866 | 1.191 | 0.5950 | Yes | ||
| 15 | POLR3E | 18100 | 1152 | 0.971 | 0.6043 | Yes | ||
| 16 | ZDHHC9 | 24163 | 1320 | 0.849 | 0.6168 | Yes | ||
| 17 | ELOVL6 | 5009 | 1454 | 0.766 | 0.6290 | Yes | ||
| 18 | H3F3B | 4839 | 1606 | 0.676 | 0.6380 | Yes | ||
| 19 | USP2 | 19480 3052 3043 | 2335 | 0.344 | 0.6074 | No | ||
| 20 | NRF1 | 17499 | 2639 | 0.262 | 0.5977 | No | ||
| 21 | SMPD3 | 18757 | 2848 | 0.226 | 0.5922 | No | ||
| 22 | AOF1 | 5746 3207 3284 | 2899 | 0.217 | 0.5950 | No | ||
| 23 | USP9X | 10264 10265 5834 | 3058 | 0.193 | 0.5914 | No | ||
| 24 | AKAP2 | 8565 | 3804 | 0.114 | 0.5541 | No | ||
| 25 | KLHL18 | 11291 | 3819 | 0.113 | 0.5563 | No | ||
| 26 | SGCD | 1425 10779 | 4459 | 0.078 | 0.5238 | No | ||
| 27 | VANGL2 | 4109 8220 | 4477 | 0.077 | 0.5248 | No | ||
| 28 | STC1 | 21974 | 5167 | 0.054 | 0.4891 | No | ||
| 29 | PRKAR2A | 5287 | 5355 | 0.049 | 0.4802 | No | ||
| 30 | BAIAP2 | 449 4236 | 5879 | 0.038 | 0.4530 | No | ||
| 31 | ARNT | 4413 1857 | 5950 | 0.037 | 0.4502 | No | ||
| 32 | HNT | 10641 | 6091 | 0.034 | 0.4435 | No | ||
| 33 | GRM3 | 16929 | 6116 | 0.034 | 0.4431 | No | ||
| 34 | IER2 | 18815 | 8072 | 0.007 | 0.3379 | No | ||
| 35 | HAS3 | 18477 | 8177 | 0.006 | 0.3324 | No | ||
| 36 | DCX | 24040 8841 4604 | 8883 | -0.002 | 0.2945 | No | ||
| 37 | CNTFR | 2515 15906 | 10148 | -0.019 | 0.2268 | No | ||
| 38 | MNT | 20784 | 10331 | -0.021 | 0.2176 | No | ||
| 39 | GPC4 | 24153 | 11189 | -0.034 | 0.1722 | No | ||
| 40 | YES1 | 5930 | 11369 | -0.037 | 0.1635 | No | ||
| 41 | CECR6 | 17018 | 11380 | -0.037 | 0.1639 | No | ||
| 42 | ATP1B4 | 12586 | 12284 | -0.056 | 0.1167 | No | ||
| 43 | CHRD | 22817 | 12453 | -0.060 | 0.1091 | No | ||
| 44 | GATA3 | 9004 | 12860 | -0.073 | 0.0891 | No | ||
| 45 | SH2D3C | 2864 | 13815 | -0.116 | 0.0406 | No | ||
| 46 | LIF | 956 667 20960 | 14064 | -0.131 | 0.0306 | No | ||
| 47 | HTR7 | 23690 | 14729 | -0.194 | -0.0003 | No | ||
| 48 | ZMYND11 | 12364 3269 3286 3223 | 14778 | -0.199 | 0.0022 | No | ||
| 49 | SAMD11 | 15641 | 14933 | -0.219 | -0.0006 | No | ||
| 50 | FZD7 | 14242 | 15014 | -0.230 | 0.0009 | No | ||
| 51 | PCDH10 | 5227 9534 1893 | 15260 | -0.265 | -0.0056 | No | ||
| 52 | SORT1 | 15452 5475 9847 | 15471 | -0.303 | -0.0092 | No | ||
| 53 | HMGN2 | 9095 | 15925 | -0.409 | -0.0233 | No | ||
| 54 | CTDSPL | 19279 | 16312 | -0.523 | -0.0308 | No | ||
| 55 | CSNK1G1 | 3057 5671 19397 | 16724 | -0.687 | -0.0356 | No | ||
| 56 | POMT2 | 5731 | 16733 | -0.691 | -0.0185 | No | ||
| 57 | COPS7B | 6502 11222 | 16745 | -0.697 | -0.0015 | No | ||
| 58 | RRAGC | 12015 | 17682 | -1.171 | -0.0223 | No | ||
| 59 | SDC4 | 14349 | 17810 | -1.261 | 0.0028 | No | ||
| 60 | MMD | 20706 | 18189 | -1.603 | 0.0230 | No |