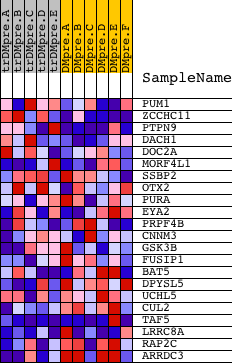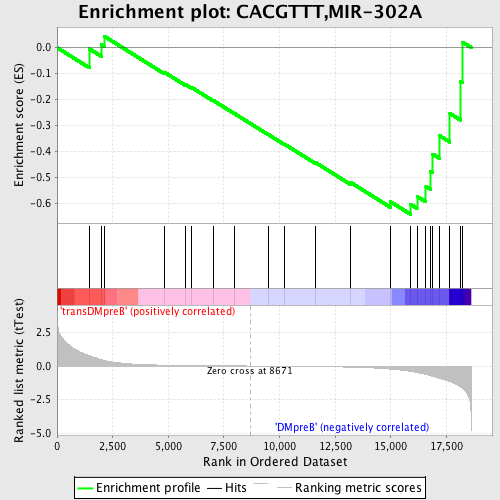
Profile of the Running ES Score & Positions of GeneSet Members on the Rank Ordered List
| Dataset | Set_04_transDMpreB_versus_DMpreB.phenotype_transDMpreB_versus_DMpreB.cls #transDMpreB_versus_DMpreB.phenotype_transDMpreB_versus_DMpreB.cls #transDMpreB_versus_DMpreB_repos |
| Phenotype | phenotype_transDMpreB_versus_DMpreB.cls#transDMpreB_versus_DMpreB_repos |
| Upregulated in class | DMpreB |
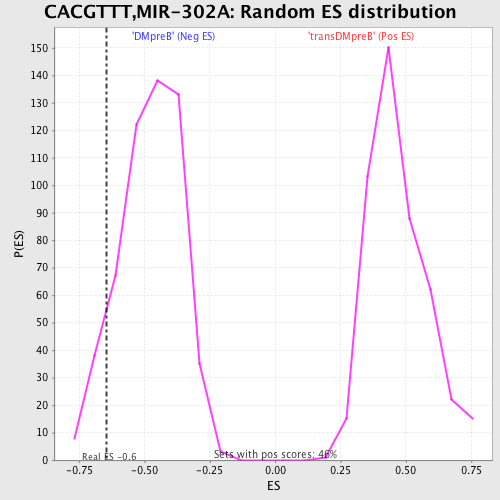
| GeneSet | CACGTTT,MIR-302A |
| Enrichment Score (ES) | -0.64352685 |
| Normalized Enrichment Score (NES) | -1.3522996 |
| Nominal p-value | 0.0882353 |
| FDR q-value | 1.0 |
| FWER p-Value | 1.0 |
| PROBE | DESCRIPTION (from dataset) | GENE SYMBOL | GENE_TITLE | RANK IN GENE LIST | RANK METRIC SCORE | RUNNING ES | CORE ENRICHMENT | |
|---|---|---|---|---|---|---|---|---|
| 1 | PUM1 | 8160 | 1456 | 0.766 | -0.0049 | No | ||
| 2 | ZCCHC11 | 6053 10500 | 1987 | 0.467 | 0.0113 | No | ||
| 3 | PTPN9 | 19434 | 2114 | 0.416 | 0.0444 | No | ||
| 4 | DACH1 | 4595 3371 | 4807 | 0.065 | -0.0942 | No | ||
| 5 | DOC2A | 18073 | 5779 | 0.040 | -0.1425 | No | ||
| 6 | MORF4L1 | 5723 | 6034 | 0.035 | -0.1528 | No | ||
| 7 | SSBP2 | 3171 7364 3252 | 7021 | 0.020 | -0.2039 | No | ||
| 8 | OTX2 | 9519 | 7989 | 0.008 | -0.2552 | No | ||
| 9 | PURA | 9670 | 9498 | -0.010 | -0.3353 | No | ||
| 10 | EYA2 | 2734 14729 | 10229 | -0.020 | -0.3726 | No | ||
| 11 | PRPF4B | 3208 5295 | 11612 | -0.041 | -0.4430 | No | ||
| 12 | CNNM3 | 4099 8250 | 13206 | -0.086 | -0.5205 | No | ||
| 13 | GSK3B | 22761 | 14988 | -0.227 | -0.5945 | No | ||
| 14 | FUSIP1 | 4715 16036 | 15900 | -0.403 | -0.6049 | Yes | ||
| 15 | BAT5 | 23261 | 16177 | -0.480 | -0.5738 | Yes | ||
| 16 | DPYSL5 | 92 | 16579 | -0.624 | -0.5355 | Yes | ||
| 17 | UCHL5 | 4108 7076 | 16776 | -0.710 | -0.4779 | Yes | ||
| 18 | CUL2 | 23630 | 16881 | -0.762 | -0.4105 | Yes | ||
| 19 | TAF5 | 23833 5934 3759 | 17191 | -0.916 | -0.3393 | Yes | ||
| 20 | LRRC8A | 15054 | 17655 | -1.152 | -0.2538 | Yes | ||
| 21 | RAP2C | 24156 | 18131 | -1.543 | -0.1315 | Yes | ||
| 22 | ARRDC3 | 4191 | 18215 | -1.643 | 0.0216 | Yes |