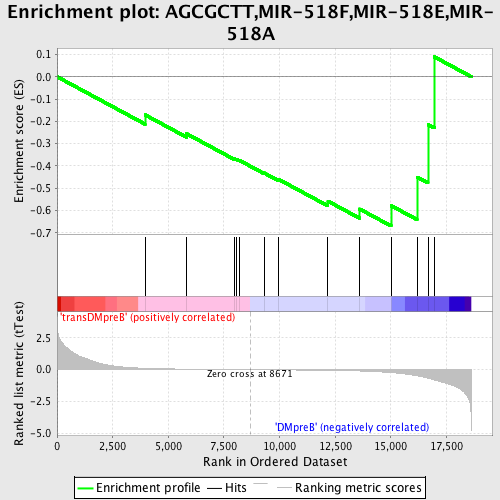
Profile of the Running ES Score & Positions of GeneSet Members on the Rank Ordered List
| Dataset | Set_04_transDMpreB_versus_DMpreB.phenotype_transDMpreB_versus_DMpreB.cls #transDMpreB_versus_DMpreB.phenotype_transDMpreB_versus_DMpreB.cls #transDMpreB_versus_DMpreB_repos |
| Phenotype | phenotype_transDMpreB_versus_DMpreB.cls#transDMpreB_versus_DMpreB_repos |
| Upregulated in class | DMpreB |
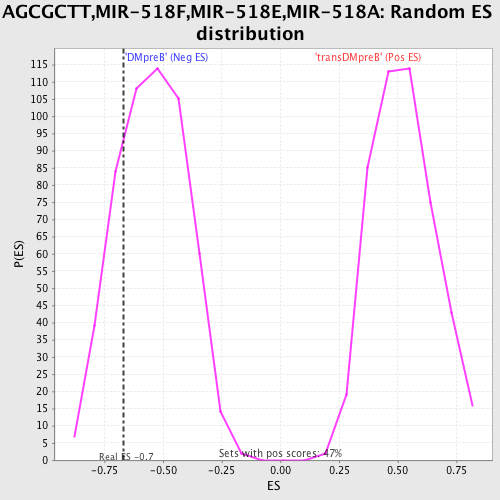
| GeneSet | AGCGCTT,MIR-518F,MIR-518E,MIR-518A |
| Enrichment Score (ES) | -0.66899765 |
| Normalized Enrichment Score (NES) | -1.2215977 |
| Nominal p-value | 0.2195122 |
| FDR q-value | 1.0 |
| FWER p-Value | 1.0 |
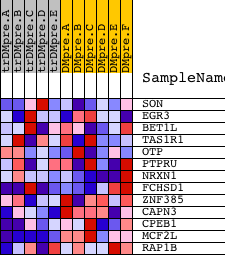
| PROBE | DESCRIPTION (from dataset) | GENE SYMBOL | GENE_TITLE | RANK IN GENE LIST | RANK METRIC SCORE | RUNNING ES | CORE ENRICHMENT | |
|---|---|---|---|---|---|---|---|---|
| 1 | SON | 5473 1657 1684 | 3954 | 0.105 | -0.1709 | No | ||
| 2 | EGR3 | 4656 | 5820 | 0.039 | -0.2556 | No | ||
| 3 | BET1L | 17570 | 7970 | 0.008 | -0.3679 | No | ||
| 4 | TAS1R1 | 15657 | 8064 | 0.007 | -0.3702 | No | ||
| 5 | OTP | 21582 | 8180 | 0.006 | -0.3741 | No | ||
| 6 | PTPRU | 15738 | 9303 | -0.008 | -0.4314 | No | ||
| 7 | NRXN1 | 1581 1575 22875 | 9960 | -0.016 | -0.4602 | No | ||
| 8 | FCHSD1 | 6661 11435 | 12175 | -0.053 | -0.5580 | No | ||
| 9 | ZNF385 | 22106 2297 | 13595 | -0.104 | -0.5929 | Yes | ||
| 10 | CAPN3 | 8686 2868 | 15012 | -0.230 | -0.5778 | Yes | ||
| 11 | CPEB1 | 8778 | 16179 | -0.481 | -0.4495 | Yes | ||
| 12 | MCF2L | 18680 5082 | 16672 | -0.659 | -0.2143 | Yes | ||
| 13 | RAP1B | 10083 | 16957 | -0.803 | 0.0892 | Yes |