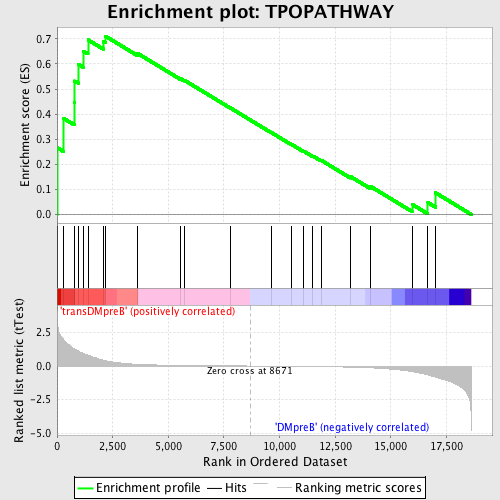
Profile of the Running ES Score & Positions of GeneSet Members on the Rank Ordered List
| Dataset | Set_04_transDMpreB_versus_DMpreB.phenotype_transDMpreB_versus_DMpreB.cls #transDMpreB_versus_DMpreB.phenotype_transDMpreB_versus_DMpreB.cls #transDMpreB_versus_DMpreB_repos |
| Phenotype | phenotype_transDMpreB_versus_DMpreB.cls#transDMpreB_versus_DMpreB_repos |
| Upregulated in class | transDMpreB |
| GeneSet | TPOPATHWAY |
| Enrichment Score (ES) | 0.7111079 |
| Normalized Enrichment Score (NES) | 1.5264629 |
| Nominal p-value | 0.02283105 |
| FDR q-value | 0.3412474 |
| FWER p-Value | 0.979 |
| PROBE | DESCRIPTION (from dataset) | GENE SYMBOL | GENE_TITLE | RANK IN GENE LIST | RANK METRIC SCORE | RUNNING ES | CORE ENRICHMENT | |
|---|---|---|---|---|---|---|---|---|
| 1 | PRKCB1 | 1693 9574 | 2 | 3.865 | 0.2665 | Yes | ||
| 2 | STAT3 | 5525 9906 | 302 | 1.915 | 0.3825 | Yes | ||
| 3 | MAP2K1 | 19082 | 767 | 1.285 | 0.4461 | Yes | ||
| 4 | GRB2 | 20149 | 792 | 1.266 | 0.5322 | Yes | ||
| 5 | MAPK3 | 6458 11170 | 961 | 1.090 | 0.5983 | Yes | ||
| 6 | RAF1 | 17035 | 1186 | 0.942 | 0.6513 | Yes | ||
| 7 | RASA1 | 10174 | 1390 | 0.808 | 0.6961 | Yes | ||
| 8 | STAT5A | 20664 | 2075 | 0.430 | 0.6890 | Yes | ||
| 9 | FOS | 21202 | 2168 | 0.392 | 0.7111 | Yes | ||
| 10 | JAK2 | 23893 9197 3706 | 3607 | 0.130 | 0.6428 | No | ||
| 11 | PLCG1 | 14753 | 5539 | 0.045 | 0.5420 | No | ||
| 12 | SOS1 | 5476 | 5727 | 0.041 | 0.5348 | No | ||
| 13 | PIK3R1 | 3170 | 7780 | 0.010 | 0.4251 | No | ||
| 14 | THPO | 22636 | 9641 | -0.012 | 0.3259 | No | ||
| 15 | CSNK2A1 | 14797 | 10544 | -0.024 | 0.2791 | No | ||
| 16 | MPL | 15780 | 11080 | -0.032 | 0.2526 | No | ||
| 17 | PIK3CA | 9562 | 11493 | -0.039 | 0.2331 | No | ||
| 18 | STAT5B | 20222 | 11863 | -0.046 | 0.2164 | No | ||
| 19 | SHC1 | 9813 9812 5430 | 13187 | -0.085 | 0.1511 | No | ||
| 20 | PRKCA | 20174 | 14071 | -0.131 | 0.1127 | No | ||
| 21 | STAT1 | 3936 5524 | 15957 | -0.419 | 0.0402 | No | ||
| 22 | JUN | 15832 | 16667 | -0.656 | 0.0474 | No | ||
| 23 | HRAS | 4868 | 17006 | -0.832 | 0.0866 | No |

