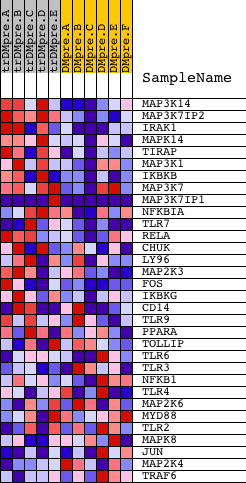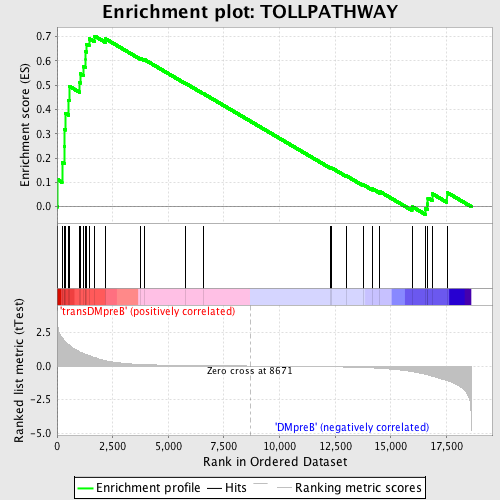
Profile of the Running ES Score & Positions of GeneSet Members on the Rank Ordered List
| Dataset | Set_04_transDMpreB_versus_DMpreB.phenotype_transDMpreB_versus_DMpreB.cls #transDMpreB_versus_DMpreB.phenotype_transDMpreB_versus_DMpreB.cls #transDMpreB_versus_DMpreB_repos |
| Phenotype | phenotype_transDMpreB_versus_DMpreB.cls#transDMpreB_versus_DMpreB_repos |
| Upregulated in class | transDMpreB |
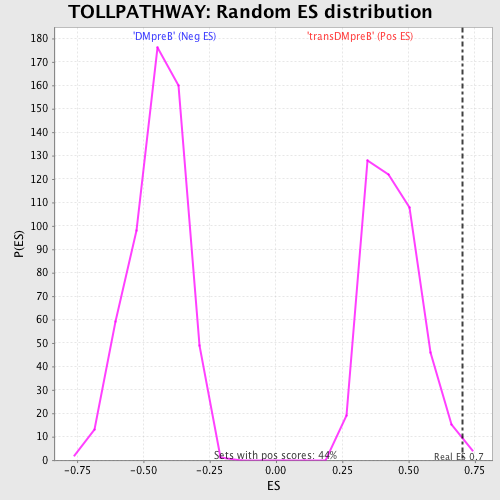
| GeneSet | TOLLPATHWAY |
| Enrichment Score (ES) | 0.70164394 |
| Normalized Enrichment Score (NES) | 1.5974593 |
| Nominal p-value | 0.009049774 |
| FDR q-value | 0.29868746 |
| FWER p-Value | 0.768 |
| PROBE | DESCRIPTION (from dataset) | GENE SYMBOL | GENE_TITLE | RANK IN GENE LIST | RANK METRIC SCORE | RUNNING ES | CORE ENRICHMENT | |
|---|---|---|---|---|---|---|---|---|
| 1 | MAP3K14 | 11998 | 27 | 2.958 | 0.1112 | Yes | ||
| 2 | MAP3K7IP2 | 19827 | 222 | 2.117 | 0.1814 | Yes | ||
| 3 | IRAK1 | 4916 | 322 | 1.872 | 0.2474 | Yes | ||
| 4 | MAPK14 | 23313 | 334 | 1.857 | 0.3176 | Yes | ||
| 5 | TIRAP | 3075 19187 | 378 | 1.797 | 0.3838 | Yes | ||
| 6 | MAP3K1 | 21348 | 512 | 1.620 | 0.4383 | Yes | ||
| 7 | IKBKB | 4907 | 558 | 1.550 | 0.4950 | Yes | ||
| 8 | MAP3K7 | 16255 | 1018 | 1.035 | 0.5097 | Yes | ||
| 9 | MAP3K7IP1 | 2193 2171 22419 | 1041 | 1.019 | 0.5473 | Yes | ||
| 10 | NFKBIA | 21065 | 1178 | 0.947 | 0.5761 | Yes | ||
| 11 | TLR7 | 24004 | 1274 | 0.878 | 0.6044 | Yes | ||
| 12 | RELA | 23783 | 1277 | 0.876 | 0.6377 | Yes | ||
| 13 | CHUK | 23665 | 1310 | 0.853 | 0.6685 | Yes | ||
| 14 | LY96 | 14292 | 1440 | 0.773 | 0.6910 | Yes | ||
| 15 | MAP2K3 | 20856 | 1692 | 0.634 | 0.7016 | Yes | ||
| 16 | FOS | 21202 | 2168 | 0.392 | 0.6910 | No | ||
| 17 | IKBKG | 2570 2562 4908 | 3736 | 0.119 | 0.6113 | No | ||
| 18 | CD14 | 23452 | 3922 | 0.107 | 0.6054 | No | ||
| 19 | TLR9 | 19331 3127 | 5777 | 0.040 | 0.5071 | No | ||
| 20 | PPARA | 22397 | 6572 | 0.027 | 0.4654 | No | ||
| 21 | TOLLIP | 7039 12038 | 12281 | -0.056 | 0.1604 | No | ||
| 22 | TLR6 | 215 16528 | 12343 | -0.057 | 0.1593 | No | ||
| 23 | TLR3 | 18884 | 13002 | -0.078 | 0.1269 | No | ||
| 24 | NFKB1 | 15160 | 13771 | -0.113 | 0.0899 | No | ||
| 25 | TLR4 | 2329 10191 5770 | 14171 | -0.139 | 0.0737 | No | ||
| 26 | MAP2K6 | 20614 1414 | 14512 | -0.170 | 0.0619 | No | ||
| 27 | MYD88 | 18970 | 15953 | -0.417 | 0.0003 | No | ||
| 28 | TLR2 | 15308 | 16556 | -0.614 | -0.0087 | No | ||
| 29 | MAPK8 | 6459 | 16644 | -0.646 | 0.0113 | No | ||
| 30 | JUN | 15832 | 16667 | -0.656 | 0.0351 | No | ||
| 31 | MAP2K4 | 20405 | 16860 | -0.753 | 0.0534 | No | ||
| 32 | TRAF6 | 5797 14940 | 17525 | -1.076 | 0.0587 | No |