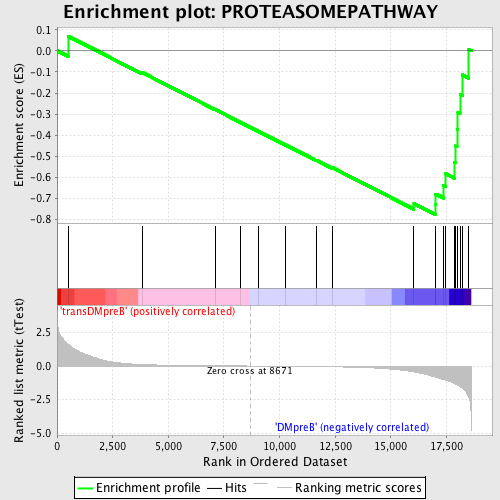
Profile of the Running ES Score & Positions of GeneSet Members on the Rank Ordered List
| Dataset | Set_04_transDMpreB_versus_DMpreB.phenotype_transDMpreB_versus_DMpreB.cls #transDMpreB_versus_DMpreB.phenotype_transDMpreB_versus_DMpreB.cls #transDMpreB_versus_DMpreB_repos |
| Phenotype | phenotype_transDMpreB_versus_DMpreB.cls#transDMpreB_versus_DMpreB_repos |
| Upregulated in class | DMpreB |
| GeneSet | PROTEASOMEPATHWAY |
| Enrichment Score (ES) | -0.77525425 |
| Normalized Enrichment Score (NES) | -1.5786415 |
| Nominal p-value | 0.005628518 |
| FDR q-value | 0.23238547 |
| FWER p-Value | 0.772 |
| PROBE | DESCRIPTION (from dataset) | GENE SYMBOL | GENE_TITLE | RANK IN GENE LIST | RANK METRIC SCORE | RUNNING ES | CORE ENRICHMENT | |
|---|---|---|---|---|---|---|---|---|
| 1 | PSMB2 | 2324 16078 | 494 | 1.634 | 0.0698 | No | ||
| 2 | UBE2A | 24358 | 3820 | 0.113 | -0.1024 | No | ||
| 3 | PSMA1 | 1627 17669 | 7105 | 0.019 | -0.2778 | No | ||
| 4 | RPN1 | 17371 | 8224 | 0.005 | -0.3377 | No | ||
| 5 | UBE1 | 24370 2551 | 9039 | -0.004 | -0.3812 | No | ||
| 6 | PSMA4 | 11179 | 10263 | -0.020 | -0.4457 | No | ||
| 7 | PSMA5 | 6464 | 11660 | -0.042 | -0.5183 | No | ||
| 8 | PSMA6 | 21270 | 12356 | -0.058 | -0.5523 | No | ||
| 9 | UBE3A | 1209 1084 1830 | 16039 | -0.443 | -0.7242 | No | ||
| 10 | PSMC3 | 9636 | 16989 | -0.820 | -0.7269 | Yes | ||
| 11 | PSMB7 | 2795 14598 | 17020 | -0.840 | -0.6790 | Yes | ||
| 12 | PSMA3 | 9632 5298 | 17363 | -1.000 | -0.6384 | Yes | ||
| 13 | PSMB4 | 15252 | 17460 | -1.042 | -0.5821 | Yes | ||
| 14 | PSMB1 | 23118 | 17872 | -1.303 | -0.5274 | Yes | ||
| 15 | PSMA2 | 9631 | 17925 | -1.349 | -0.4507 | Yes | ||
| 16 | PSMD14 | 15005 | 17976 | -1.387 | -0.3716 | Yes | ||
| 17 | PSMB3 | 11180 | 18016 | -1.424 | -0.2898 | Yes | ||
| 18 | PSMA7 | 14318 | 18110 | -1.516 | -0.2054 | Yes | ||
| 19 | PSMB6 | 9634 | 18218 | -1.647 | -0.1140 | Yes | ||
| 20 | PSMB5 | 9633 | 18507 | -2.296 | 0.0059 | Yes |

