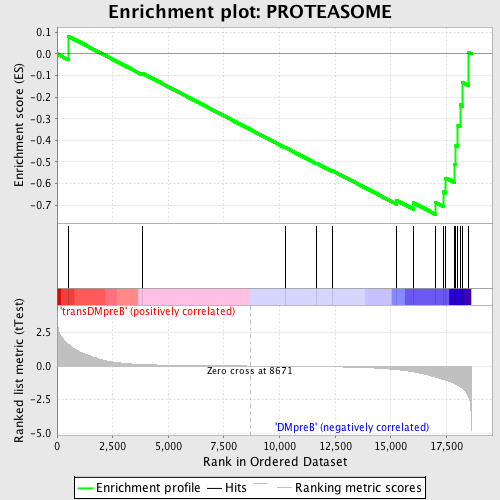
Profile of the Running ES Score & Positions of GeneSet Members on the Rank Ordered List
| Dataset | Set_04_transDMpreB_versus_DMpreB.phenotype_transDMpreB_versus_DMpreB.cls #transDMpreB_versus_DMpreB.phenotype_transDMpreB_versus_DMpreB.cls #transDMpreB_versus_DMpreB_repos |
| Phenotype | phenotype_transDMpreB_versus_DMpreB.cls#transDMpreB_versus_DMpreB_repos |
| Upregulated in class | DMpreB |
| GeneSet | PROTEASOME |
| Enrichment Score (ES) | -0.743279 |
| Normalized Enrichment Score (NES) | -1.4587945 |
| Nominal p-value | 0.04238921 |
| FDR q-value | 0.31612566 |
| FWER p-Value | 0.998 |
| PROBE | DESCRIPTION (from dataset) | GENE SYMBOL | GENE_TITLE | RANK IN GENE LIST | RANK METRIC SCORE | RUNNING ES | CORE ENRICHMENT | |
|---|---|---|---|---|---|---|---|---|
| 1 | PSMB2 | 2324 16078 | 494 | 1.634 | 0.0825 | No | ||
| 2 | PSMB9 | 23021 | 3824 | 0.113 | -0.0890 | No | ||
| 3 | PSMA4 | 11179 | 10263 | -0.020 | -0.4337 | No | ||
| 4 | PSMA5 | 6464 | 11660 | -0.042 | -0.5060 | No | ||
| 5 | PSMA6 | 21270 | 12356 | -0.058 | -0.5395 | No | ||
| 6 | PSMB8 | 5000 | 15261 | -0.265 | -0.6779 | No | ||
| 7 | PSMB10 | 5299 18761 | 16020 | -0.436 | -0.6896 | Yes | ||
| 8 | PSMB7 | 2795 14598 | 17020 | -0.840 | -0.6873 | Yes | ||
| 9 | PSMA3 | 9632 5298 | 17363 | -1.000 | -0.6389 | Yes | ||
| 10 | PSMB4 | 15252 | 17460 | -1.042 | -0.5745 | Yes | ||
| 11 | PSMB1 | 23118 | 17872 | -1.303 | -0.5096 | Yes | ||
| 12 | PSMA2 | 9631 | 17925 | -1.349 | -0.4224 | Yes | ||
| 13 | PSMB3 | 11180 | 18016 | -1.424 | -0.3322 | Yes | ||
| 14 | PSMA7 | 14318 | 18110 | -1.516 | -0.2361 | Yes | ||
| 15 | PSMB6 | 9634 | 18218 | -1.647 | -0.1319 | Yes | ||
| 16 | PSMB5 | 9633 | 18507 | -2.296 | 0.0059 | Yes |

