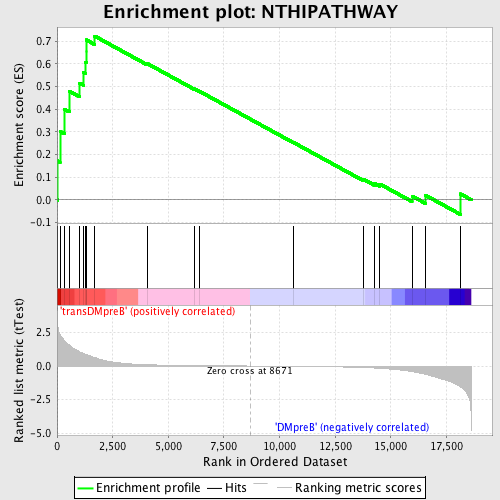
Profile of the Running ES Score & Positions of GeneSet Members on the Rank Ordered List
| Dataset | Set_04_transDMpreB_versus_DMpreB.phenotype_transDMpreB_versus_DMpreB.cls #transDMpreB_versus_DMpreB.phenotype_transDMpreB_versus_DMpreB.cls #transDMpreB_versus_DMpreB_repos |
| Phenotype | phenotype_transDMpreB_versus_DMpreB.cls#transDMpreB_versus_DMpreB_repos |
| Upregulated in class | transDMpreB |
| GeneSet | NTHIPATHWAY |
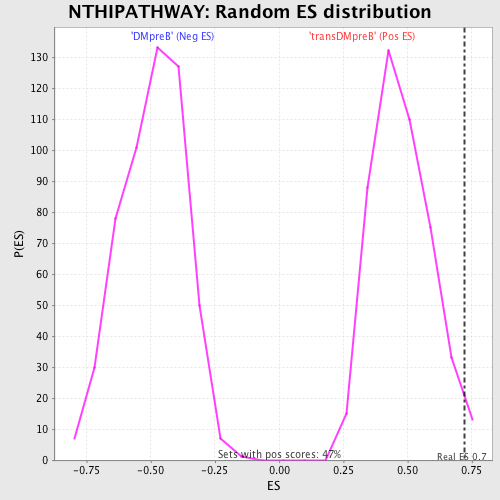
| Enrichment Score (ES) | 0.72227824 |
| Normalized Enrichment Score (NES) | 1.5197442 |
| Nominal p-value | 0.021459227 |
| FDR q-value | 0.29594666 |
| FWER p-Value | 0.984 |
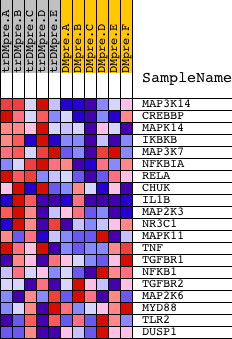
| PROBE | DESCRIPTION (from dataset) | GENE SYMBOL | GENE_TITLE | RANK IN GENE LIST | RANK METRIC SCORE | RUNNING ES | CORE ENRICHMENT | |
|---|---|---|---|---|---|---|---|---|
| 1 | MAP3K14 | 11998 | 27 | 2.958 | 0.1718 | Yes | ||
| 2 | CREBBP | 22682 8783 | 133 | 2.312 | 0.3016 | Yes | ||
| 3 | MAPK14 | 23313 | 334 | 1.857 | 0.3996 | Yes | ||
| 4 | IKBKB | 4907 | 558 | 1.550 | 0.4784 | Yes | ||
| 5 | MAP3K7 | 16255 | 1018 | 1.035 | 0.5144 | Yes | ||
| 6 | NFKBIA | 21065 | 1178 | 0.947 | 0.5613 | Yes | ||
| 7 | RELA | 23783 | 1277 | 0.876 | 0.6074 | Yes | ||
| 8 | CHUK | 23665 | 1310 | 0.853 | 0.6556 | Yes | ||
| 9 | IL1B | 14431 | 1311 | 0.852 | 0.7055 | Yes | ||
| 10 | MAP2K3 | 20856 | 1692 | 0.634 | 0.7223 | Yes | ||
| 11 | NR3C1 | 9043 | 4051 | 0.099 | 0.6013 | No | ||
| 12 | MAPK11 | 2264 9618 22163 | 6170 | 0.033 | 0.4893 | No | ||
| 13 | TNF | 23004 | 6399 | 0.029 | 0.4788 | No | ||
| 14 | TGFBR1 | 16213 10165 5745 | 10621 | -0.025 | 0.2533 | No | ||
| 15 | NFKB1 | 15160 | 13771 | -0.113 | 0.0906 | No | ||
| 16 | TGFBR2 | 2994 3001 10167 | 14270 | -0.147 | 0.0725 | No | ||
| 17 | MAP2K6 | 20614 1414 | 14512 | -0.170 | 0.0695 | No | ||
| 18 | MYD88 | 18970 | 15953 | -0.417 | 0.0165 | No | ||
| 19 | TLR2 | 15308 | 16556 | -0.614 | 0.0201 | No | ||
| 20 | DUSP1 | 23061 | 18133 | -1.547 | 0.0260 | No |