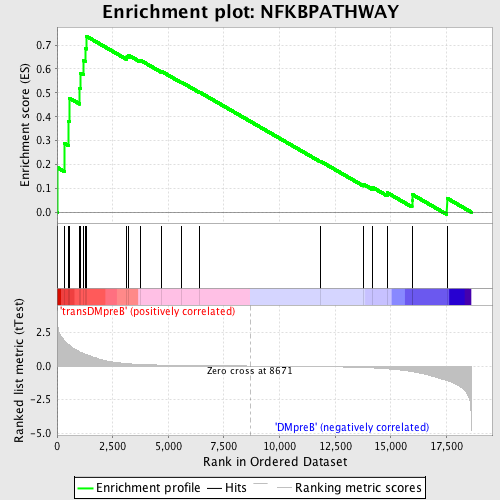
Profile of the Running ES Score & Positions of GeneSet Members on the Rank Ordered List
| Dataset | Set_04_transDMpreB_versus_DMpreB.phenotype_transDMpreB_versus_DMpreB.cls #transDMpreB_versus_DMpreB.phenotype_transDMpreB_versus_DMpreB.cls #transDMpreB_versus_DMpreB_repos |
| Phenotype | phenotype_transDMpreB_versus_DMpreB.cls#transDMpreB_versus_DMpreB_repos |
| Upregulated in class | transDMpreB |
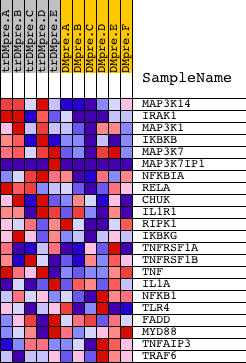
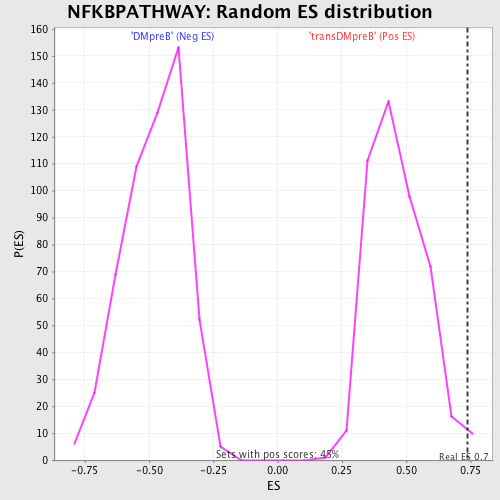
| GeneSet | NFKBPATHWAY |
| Enrichment Score (ES) | 0.7377591 |
| Normalized Enrichment Score (NES) | 1.5856667 |
| Nominal p-value | 0.011061947 |
| FDR q-value | 0.24920374 |
| FWER p-Value | 0.832 |
| PROBE | DESCRIPTION (from dataset) | GENE SYMBOL | GENE_TITLE | RANK IN GENE LIST | RANK METRIC SCORE | RUNNING ES | CORE ENRICHMENT | |
|---|---|---|---|---|---|---|---|---|
| 1 | MAP3K14 | 11998 | 27 | 2.958 | 0.1862 | Yes | ||
| 2 | IRAK1 | 4916 | 322 | 1.872 | 0.2892 | Yes | ||
| 3 | MAP3K1 | 21348 | 512 | 1.620 | 0.3818 | Yes | ||
| 4 | IKBKB | 4907 | 558 | 1.550 | 0.4778 | Yes | ||
| 5 | MAP3K7 | 16255 | 1018 | 1.035 | 0.5188 | Yes | ||
| 6 | MAP3K7IP1 | 2193 2171 22419 | 1041 | 1.019 | 0.5823 | Yes | ||
| 7 | NFKBIA | 21065 | 1178 | 0.947 | 0.6351 | Yes | ||
| 8 | RELA | 23783 | 1277 | 0.876 | 0.6854 | Yes | ||
| 9 | CHUK | 23665 | 1310 | 0.853 | 0.7378 | Yes | ||
| 10 | IL1R1 | 14264 3987 | 3140 | 0.181 | 0.6509 | No | ||
| 11 | RIPK1 | 5381 | 3213 | 0.170 | 0.6578 | No | ||
| 12 | IKBKG | 2570 2562 4908 | 3736 | 0.119 | 0.6373 | No | ||
| 13 | TNFRSF1A | 1181 10206 | 4709 | 0.068 | 0.5893 | No | ||
| 14 | TNFRSF1B | 5782 2346 | 5580 | 0.044 | 0.5453 | No | ||
| 15 | TNF | 23004 | 6399 | 0.029 | 0.5032 | No | ||
| 16 | IL1A | 4915 | 11826 | -0.045 | 0.2143 | No | ||
| 17 | NFKB1 | 15160 | 13771 | -0.113 | 0.1169 | No | ||
| 18 | TLR4 | 2329 10191 5770 | 14171 | -0.139 | 0.1043 | No | ||
| 19 | FADD | 17536 8950 4711 | 14843 | -0.208 | 0.0814 | No | ||
| 20 | MYD88 | 18970 | 15953 | -0.417 | 0.0482 | No | ||
| 21 | TNFAIP3 | 19810 | 15960 | -0.419 | 0.0745 | No | ||
| 22 | TRAF6 | 5797 14940 | 17525 | -1.076 | 0.0587 | No |