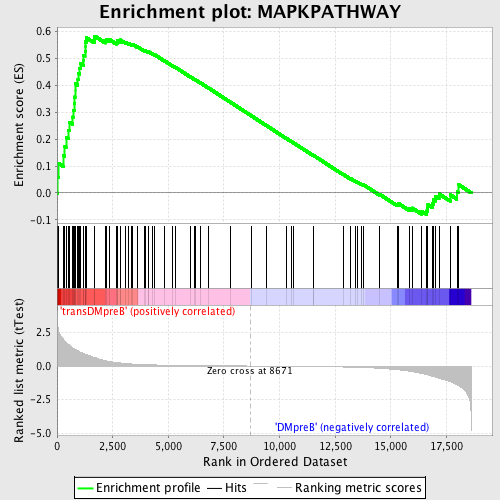
Profile of the Running ES Score & Positions of GeneSet Members on the Rank Ordered List
| Dataset | Set_04_transDMpreB_versus_DMpreB.phenotype_transDMpreB_versus_DMpreB.cls #transDMpreB_versus_DMpreB.phenotype_transDMpreB_versus_DMpreB.cls #transDMpreB_versus_DMpreB_repos |
| Phenotype | phenotype_transDMpreB_versus_DMpreB.cls#transDMpreB_versus_DMpreB_repos |
| Upregulated in class | transDMpreB |
| GeneSet | MAPKPATHWAY |
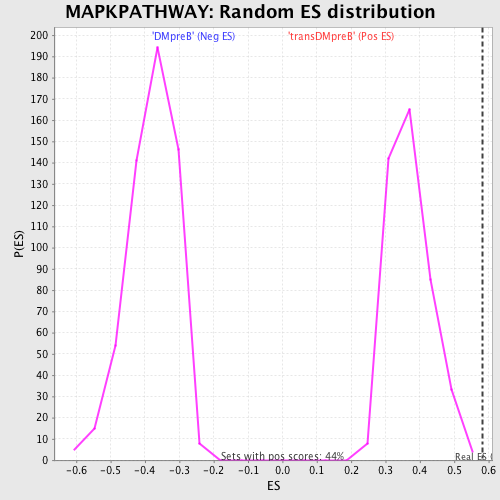
| Enrichment Score (ES) | 0.5833614 |
| Normalized Enrichment Score (NES) | 1.5725595 |
| Nominal p-value | 0.0 |
| FDR q-value | 0.27194908 |
| FWER p-Value | 0.876 |

| PROBE | DESCRIPTION (from dataset) | GENE SYMBOL | GENE_TITLE | RANK IN GENE LIST | RANK METRIC SCORE | RUNNING ES | CORE ENRICHMENT | |
|---|---|---|---|---|---|---|---|---|
| 1 | MAP3K14 | 11998 | 27 | 2.958 | 0.0589 | Yes | ||
| 2 | MAP4K2 | 6457 | 72 | 2.603 | 0.1096 | Yes | ||
| 3 | MAP3K11 | 11163 | 275 | 2.001 | 0.1395 | Yes | ||
| 4 | MAPK14 | 23313 | 334 | 1.857 | 0.1743 | Yes | ||
| 5 | MEF2C | 3204 9378 | 403 | 1.759 | 0.2065 | Yes | ||
| 6 | MAP3K1 | 21348 | 512 | 1.620 | 0.2337 | Yes | ||
| 7 | IKBKB | 4907 | 558 | 1.550 | 0.2629 | Yes | ||
| 8 | MAX | 21034 | 708 | 1.356 | 0.2825 | Yes | ||
| 9 | RPS6KA1 | 15725 | 736 | 1.314 | 0.3079 | Yes | ||
| 10 | MAP2K1 | 19082 | 767 | 1.285 | 0.3325 | Yes | ||
| 11 | GRB2 | 20149 | 792 | 1.266 | 0.3570 | Yes | ||
| 12 | MAP3K3 | 20626 | 808 | 1.254 | 0.3818 | Yes | ||
| 13 | MKNK2 | 3299 9392 | 809 | 1.250 | 0.4073 | Yes | ||
| 14 | RPS6KA4 | 23804 | 933 | 1.130 | 0.4237 | Yes | ||
| 15 | MAPK3 | 6458 11170 | 961 | 1.090 | 0.4445 | Yes | ||
| 16 | MAP3K7 | 16255 | 1018 | 1.035 | 0.4625 | Yes | ||
| 17 | TRAF2 | 14657 | 1044 | 1.018 | 0.4820 | Yes | ||
| 18 | NFKBIA | 21065 | 1178 | 0.947 | 0.4941 | Yes | ||
| 19 | RAF1 | 17035 | 1186 | 0.942 | 0.5130 | Yes | ||
| 20 | MKNK1 | 2504 | 1254 | 0.891 | 0.5275 | Yes | ||
| 21 | RELA | 23783 | 1277 | 0.876 | 0.5442 | Yes | ||
| 22 | MAP3K8 | 23495 | 1281 | 0.872 | 0.5618 | Yes | ||
| 23 | CHUK | 23665 | 1310 | 0.853 | 0.5777 | Yes | ||
| 24 | MAP2K2 | 19933 | 1669 | 0.648 | 0.5716 | Yes | ||
| 25 | MAP2K3 | 20856 | 1692 | 0.634 | 0.5834 | Yes | ||
| 26 | FOS | 21202 | 2168 | 0.392 | 0.5657 | No | ||
| 27 | MAP4K3 | 22887 | 2224 | 0.377 | 0.5705 | No | ||
| 28 | MAP3K2 | 11165 | 2345 | 0.340 | 0.5709 | No | ||
| 29 | DAXX | 23290 | 2662 | 0.257 | 0.5591 | No | ||
| 30 | RPS6KB1 | 7815 1207 13040 | 2699 | 0.250 | 0.5623 | No | ||
| 31 | MAPK12 | 2182 2215 22164 | 2721 | 0.246 | 0.5662 | No | ||
| 32 | MAP3K12 | 6454 11164 | 2832 | 0.229 | 0.5649 | No | ||
| 33 | SP1 | 9852 | 2840 | 0.228 | 0.5692 | No | ||
| 34 | MAP3K5 | 20079 11166 | 3069 | 0.191 | 0.5608 | No | ||
| 35 | RIPK1 | 5381 | 3213 | 0.170 | 0.5565 | No | ||
| 36 | MAP4K4 | 11241 | 3363 | 0.151 | 0.5516 | No | ||
| 37 | MAP3K10 | 3831 17916 | 3402 | 0.147 | 0.5525 | No | ||
| 38 | PAK1 | 9527 | 3601 | 0.130 | 0.5445 | No | ||
| 39 | TGFB1 | 18332 | 3946 | 0.105 | 0.5281 | No | ||
| 40 | CREB1 | 3990 8782 4558 4093 | 3961 | 0.105 | 0.5295 | No | ||
| 41 | MAPK9 | 1233 20903 1383 | 4094 | 0.096 | 0.5243 | No | ||
| 42 | MYC | 22465 9435 | 4110 | 0.095 | 0.5254 | No | ||
| 43 | MAP3K9 | 6872 | 4297 | 0.084 | 0.5171 | No | ||
| 44 | MAPK13 | 23314 | 4397 | 0.080 | 0.5134 | No | ||
| 45 | RPS6KA5 | 2076 21005 | 4837 | 0.064 | 0.4910 | No | ||
| 46 | RPS6KA2 | 9759 9758 | 5200 | 0.053 | 0.4726 | No | ||
| 47 | MAPK7 | 1381 20414 | 5307 | 0.050 | 0.4679 | No | ||
| 48 | MAP4K1 | 18313 | 6010 | 0.036 | 0.4307 | No | ||
| 49 | MAPK11 | 2264 9618 22163 | 6170 | 0.033 | 0.4228 | No | ||
| 50 | MAP3K6 | 16054 | 6199 | 0.033 | 0.4220 | No | ||
| 51 | MAPKAPK5 | 16387 | 6436 | 0.029 | 0.4098 | No | ||
| 52 | MEF2D | 9379 | 6789 | 0.023 | 0.3913 | No | ||
| 53 | MAP3K4 | 23126 | 7801 | 0.010 | 0.3370 | No | ||
| 54 | TGFB3 | 10161 | 8719 | -0.001 | 0.2875 | No | ||
| 55 | RPS6KB2 | 7198 | 9416 | -0.009 | 0.2502 | No | ||
| 56 | MEF2B | 9377 | 10293 | -0.021 | 0.2033 | No | ||
| 57 | MAP4K5 | 11853 21048 2101 2142 | 10536 | -0.024 | 0.1908 | No | ||
| 58 | TGFBR1 | 16213 10165 5745 | 10621 | -0.025 | 0.1867 | No | ||
| 59 | MAP2K7 | 6453 | 11507 | -0.039 | 0.1398 | No | ||
| 60 | MAPK4 | 23409 | 11523 | -0.039 | 0.1398 | No | ||
| 61 | MAPKAPK2 | 13838 | 12872 | -0.073 | 0.0686 | No | ||
| 62 | SHC1 | 9813 9812 5430 | 13187 | -0.085 | 0.0533 | No | ||
| 63 | CEBPA | 4514 | 13422 | -0.095 | 0.0427 | No | ||
| 64 | MAPK10 | 11169 | 13511 | -0.099 | 0.0399 | No | ||
| 65 | MAP3K13 | 22814 | 13677 | -0.108 | 0.0332 | No | ||
| 66 | NFKB1 | 15160 | 13771 | -0.113 | 0.0305 | No | ||
| 67 | MAP2K6 | 20614 1414 | 14512 | -0.170 | -0.0059 | No | ||
| 68 | ATF2 | 4418 2759 | 15291 | -0.272 | -0.0423 | No | ||
| 69 | MEF2A | 1201 5089 3492 | 15337 | -0.280 | -0.0391 | No | ||
| 70 | RPS6KA3 | 8490 | 15832 | -0.385 | -0.0579 | No | ||
| 71 | STAT1 | 3936 5524 | 15957 | -0.419 | -0.0560 | No | ||
| 72 | RAC1 | 16302 | 16377 | -0.547 | -0.0675 | No | ||
| 73 | MAPKAPK3 | 19003 | 16613 | -0.637 | -0.0671 | No | ||
| 74 | MAPK8 | 6459 | 16644 | -0.646 | -0.0556 | No | ||
| 75 | JUN | 15832 | 16667 | -0.656 | -0.0434 | No | ||
| 76 | MAP2K4 | 20405 | 16860 | -0.753 | -0.0384 | No | ||
| 77 | PAK2 | 10310 5875 | 16924 | -0.783 | -0.0258 | No | ||
| 78 | HRAS | 4868 | 17006 | -0.832 | -0.0132 | No | ||
| 79 | MAP2K5 | 19088 | 17169 | -0.904 | -0.0035 | No | ||
| 80 | MAPK1 | 1642 11167 | 17667 | -1.160 | -0.0066 | No | ||
| 81 | TGFB2 | 5743 | 17974 | -1.384 | 0.0051 | No | ||
| 82 | MAPK6 | 19062 | 18044 | -1.445 | 0.0309 | No |

