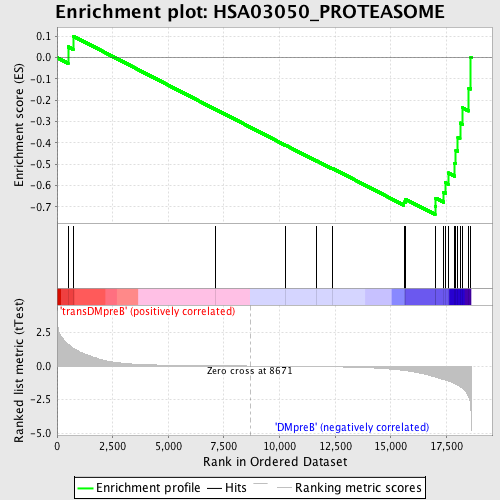
Profile of the Running ES Score & Positions of GeneSet Members on the Rank Ordered List
| Dataset | Set_04_transDMpreB_versus_DMpreB.phenotype_transDMpreB_versus_DMpreB.cls #transDMpreB_versus_DMpreB.phenotype_transDMpreB_versus_DMpreB.cls #transDMpreB_versus_DMpreB_repos |
| Phenotype | phenotype_transDMpreB_versus_DMpreB.cls#transDMpreB_versus_DMpreB_repos |
| Upregulated in class | DMpreB |
| GeneSet | HSA03050_PROTEASOME |
| Enrichment Score (ES) | -0.73547393 |
| Normalized Enrichment Score (NES) | -1.4661199 |
| Nominal p-value | 0.022857143 |
| FDR q-value | 0.33376423 |
| FWER p-Value | 0.997 |
| PROBE | DESCRIPTION (from dataset) | GENE SYMBOL | GENE_TITLE | RANK IN GENE LIST | RANK METRIC SCORE | RUNNING ES | CORE ENRICHMENT | |
|---|---|---|---|---|---|---|---|---|
| 1 | PSMB2 | 2324 16078 | 494 | 1.634 | 0.0502 | No | ||
| 2 | PSMD13 | 18019 3897 | 721 | 1.333 | 0.1006 | No | ||
| 3 | PSMA1 | 1627 17669 | 7105 | 0.019 | -0.2417 | No | ||
| 4 | PSMA4 | 11179 | 10263 | -0.020 | -0.4105 | No | ||
| 5 | PSMA5 | 6464 | 11660 | -0.042 | -0.4836 | No | ||
| 6 | PSMA6 | 21270 | 12356 | -0.058 | -0.5183 | No | ||
| 7 | PSMD11 | 12772 7600 | 15592 | -0.330 | -0.6768 | No | ||
| 8 | PSMD12 | 20621 | 15664 | -0.347 | -0.6643 | No | ||
| 9 | PSMC3 | 9636 | 16989 | -0.820 | -0.6970 | Yes | ||
| 10 | PSMB7 | 2795 14598 | 17020 | -0.840 | -0.6591 | Yes | ||
| 11 | PSMA3 | 9632 5298 | 17363 | -1.000 | -0.6305 | Yes | ||
| 12 | PSMB4 | 15252 | 17460 | -1.042 | -0.5868 | Yes | ||
| 13 | PSMC2 | 16909 | 17578 | -1.113 | -0.5408 | Yes | ||
| 14 | PSMB1 | 23118 | 17872 | -1.303 | -0.4953 | Yes | ||
| 15 | PSMA2 | 9631 | 17925 | -1.349 | -0.4348 | Yes | ||
| 16 | PSMB3 | 11180 | 18016 | -1.424 | -0.3728 | Yes | ||
| 17 | PSMA7 | 14318 | 18110 | -1.516 | -0.3066 | Yes | ||
| 18 | PSMB6 | 9634 | 18218 | -1.647 | -0.2350 | Yes | ||
| 19 | PSMB5 | 9633 | 18507 | -2.296 | -0.1426 | Yes | ||
| 20 | PSMD2 | 10137 5724 | 18598 | -3.160 | 0.0010 | Yes |

