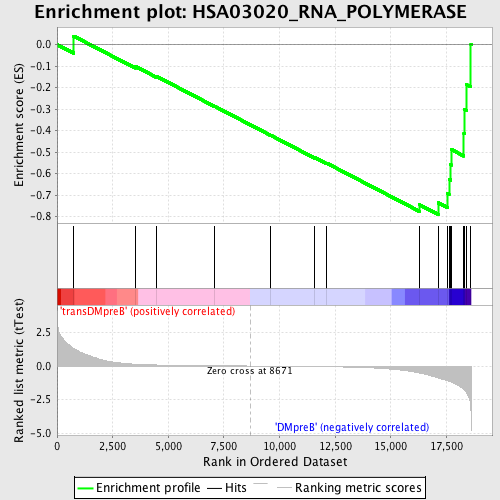
Profile of the Running ES Score & Positions of GeneSet Members on the Rank Ordered List
| Dataset | Set_04_transDMpreB_versus_DMpreB.phenotype_transDMpreB_versus_DMpreB.cls #transDMpreB_versus_DMpreB.phenotype_transDMpreB_versus_DMpreB.cls #transDMpreB_versus_DMpreB_repos |
| Phenotype | phenotype_transDMpreB_versus_DMpreB.cls#transDMpreB_versus_DMpreB_repos |
| Upregulated in class | DMpreB |
| GeneSet | HSA03020_RNA_POLYMERASE |
| Enrichment Score (ES) | -0.7896293 |
| Normalized Enrichment Score (NES) | -1.5910884 |
| Nominal p-value | 0.0071174377 |
| FDR q-value | 0.24901271 |
| FWER p-Value | 0.689 |
| PROBE | DESCRIPTION (from dataset) | GENE SYMBOL | GENE_TITLE | RANK IN GENE LIST | RANK METRIC SCORE | RUNNING ES | CORE ENRICHMENT | |
|---|---|---|---|---|---|---|---|---|
| 1 | POLR1A | 9749 5393 | 745 | 1.304 | 0.0394 | No | ||
| 2 | POLR3A | 21900 | 3508 | 0.137 | -0.1007 | No | ||
| 3 | POLR2C | 9750 | 4458 | 0.078 | -0.1470 | No | ||
| 4 | POLR3K | 12447 7372 | 7063 | 0.019 | -0.2858 | No | ||
| 5 | POLR2B | 16817 | 9610 | -0.012 | -0.4220 | No | ||
| 6 | POLR3H | 13460 8135 | 11584 | -0.041 | -0.5256 | No | ||
| 7 | POLR2A | 5394 | 12113 | -0.052 | -0.5508 | No | ||
| 8 | POLR2E | 3325 19699 | 16276 | -0.508 | -0.7437 | Yes | ||
| 9 | POLR2J | 16672 | 17132 | -0.889 | -0.7355 | Yes | ||
| 10 | ZNRD1 | 1491 22987 | 17540 | -1.081 | -0.6915 | Yes | ||
| 11 | POLR3B | 12875 | 17620 | -1.135 | -0.6266 | Yes | ||
| 12 | POLR2I | 12839 | 17691 | -1.175 | -0.5588 | Yes | ||
| 13 | POLR1B | 14857 | 17713 | -1.191 | -0.4874 | Yes | ||
| 14 | POLR1D | 3593 3658 16623 | 18284 | -1.749 | -0.4115 | Yes | ||
| 15 | POLR2H | 10888 | 18321 | -1.818 | -0.3027 | Yes | ||
| 16 | POLR2G | 23753 | 18407 | -1.978 | -0.1868 | Yes | ||
| 17 | POLR2K | 9413 | 18599 | -3.250 | 0.0009 | Yes |

