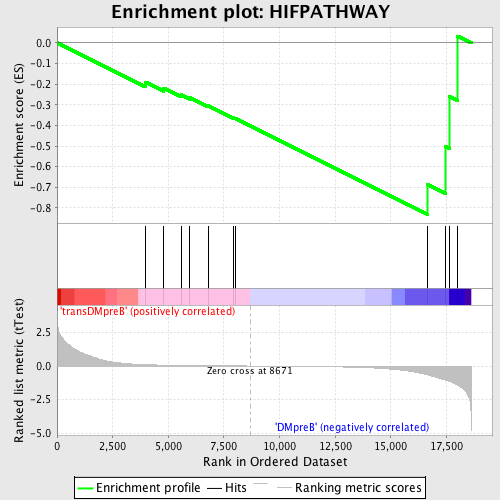
Profile of the Running ES Score & Positions of GeneSet Members on the Rank Ordered List
| Dataset | Set_04_transDMpreB_versus_DMpreB.phenotype_transDMpreB_versus_DMpreB.cls #transDMpreB_versus_DMpreB.phenotype_transDMpreB_versus_DMpreB.cls #transDMpreB_versus_DMpreB_repos |
| Phenotype | phenotype_transDMpreB_versus_DMpreB.cls#transDMpreB_versus_DMpreB_repos |
| Upregulated in class | DMpreB |
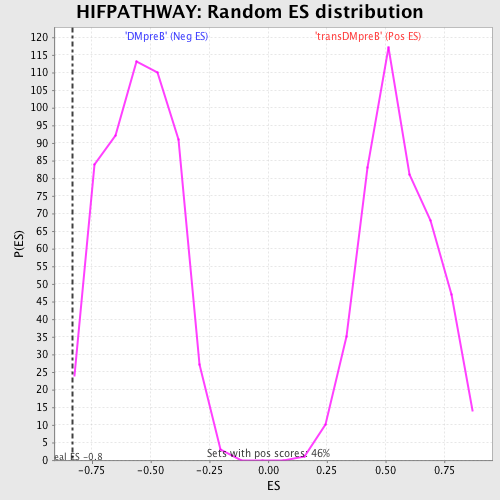
| GeneSet | HIFPATHWAY |
| Enrichment Score (ES) | -0.8317348 |
| Normalized Enrichment Score (NES) | -1.5102947 |
| Nominal p-value | 0.009191177 |
| FDR q-value | 0.28095153 |
| FWER p-Value | 0.978 |
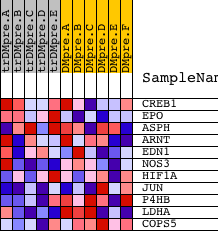
| PROBE | DESCRIPTION (from dataset) | GENE SYMBOL | GENE_TITLE | RANK IN GENE LIST | RANK METRIC SCORE | RUNNING ES | CORE ENRICHMENT | |
|---|---|---|---|---|---|---|---|---|
| 1 | CREB1 | 3990 8782 4558 4093 | 3961 | 0.105 | -0.1899 | No | ||
| 2 | EPO | 8911 | 4785 | 0.065 | -0.2198 | No | ||
| 3 | ASPH | 2498 2460 2396 2370 2357 2502 2516 2375 2337 12276 2381 2454 7246 2480 2393 | 5572 | 0.044 | -0.2523 | No | ||
| 4 | ARNT | 4413 1857 | 5950 | 0.037 | -0.2645 | No | ||
| 5 | EDN1 | 21658 | 6809 | 0.023 | -0.3056 | No | ||
| 6 | NOS3 | 16906 885 | 7918 | 0.009 | -0.3633 | No | ||
| 7 | HIF1A | 4850 | 8016 | 0.007 | -0.3668 | No | ||
| 8 | JUN | 15832 | 16667 | -0.656 | -0.6874 | Yes | ||
| 9 | P4HB | 20115 | 17451 | -1.038 | -0.5014 | Yes | ||
| 10 | LDHA | 9269 | 17646 | -1.146 | -0.2598 | Yes | ||
| 11 | COPS5 | 4117 14002 | 18012 | -1.419 | 0.0325 | Yes |