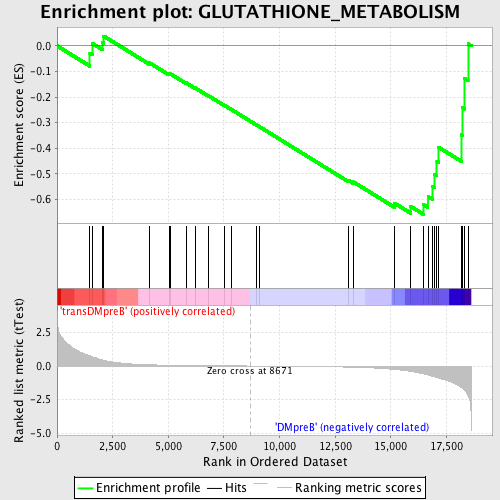
Profile of the Running ES Score & Positions of GeneSet Members on the Rank Ordered List
| Dataset | Set_04_transDMpreB_versus_DMpreB.phenotype_transDMpreB_versus_DMpreB.cls #transDMpreB_versus_DMpreB.phenotype_transDMpreB_versus_DMpreB.cls #transDMpreB_versus_DMpreB_repos |
| Phenotype | phenotype_transDMpreB_versus_DMpreB.cls#transDMpreB_versus_DMpreB_repos |
| Upregulated in class | DMpreB |
| GeneSet | GLUTATHIONE_METABOLISM |
| Enrichment Score (ES) | -0.6590858 |
| Normalized Enrichment Score (NES) | -1.4600592 |
| Nominal p-value | 0.031539887 |
| FDR q-value | 0.3341372 |
| FWER p-Value | 0.998 |
| PROBE | DESCRIPTION (from dataset) | GENE SYMBOL | GENE_TITLE | RANK IN GENE LIST | RANK METRIC SCORE | RUNNING ES | CORE ENRICHMENT | |
|---|---|---|---|---|---|---|---|---|
| 1 | IDH2 | 17781 | 1475 | 0.755 | -0.0300 | No | ||
| 2 | GPX1 | 19310 | 1580 | 0.693 | 0.0098 | No | ||
| 3 | GPX2 | 9037 | 2054 | 0.438 | 0.0130 | No | ||
| 4 | GCLC | 19374 | 2099 | 0.420 | 0.0381 | No | ||
| 5 | PGD | 8475 | 4154 | 0.092 | -0.0664 | No | ||
| 6 | GGT1 | 19987 | 5034 | 0.058 | -0.1099 | No | ||
| 7 | GSTA2 | 4808 6173 | 5087 | 0.056 | -0.1090 | No | ||
| 8 | GPX3 | 20880 | 5793 | 0.040 | -0.1443 | No | ||
| 9 | GSS | 14380 9047 | 6204 | 0.032 | -0.1643 | No | ||
| 10 | GCLM | 9019 | 6802 | 0.023 | -0.1949 | No | ||
| 11 | GSTM2 | 9049 4810 | 7504 | 0.013 | -0.2317 | No | ||
| 12 | GSTA1 | 4807 | 7853 | 0.009 | -0.2498 | No | ||
| 13 | GSTA3 | 14287 | 8943 | -0.003 | -0.3082 | No | ||
| 14 | GPX5 | 21532 3242 | 9106 | -0.005 | -0.3166 | No | ||
| 15 | GSTM3 | 9050 | 13076 | -0.081 | -0.5248 | No | ||
| 16 | GSTM1 | 4809 9048 | 13320 | -0.090 | -0.5320 | No | ||
| 17 | MGST2 | 15597 | 15169 | -0.251 | -0.6150 | No | ||
| 18 | IDH1 | 4894 | 15895 | -0.401 | -0.6278 | Yes | ||
| 19 | GSTP1 | 9051 4812 4811 | 16478 | -0.579 | -0.6212 | Yes | ||
| 20 | GSTA4 | 19371 | 16671 | -0.658 | -0.5885 | Yes | ||
| 21 | GSTZ1 | 21193 | 16879 | -0.761 | -0.5498 | Yes | ||
| 22 | GSTM4 | 15199 | 16952 | -0.801 | -0.5013 | Yes | ||
| 23 | GSTT1 | 19730 | 17072 | -0.866 | -0.4511 | Yes | ||
| 24 | GSTM5 | 15455 | 17148 | -0.898 | -0.3964 | Yes | ||
| 25 | GSTT2 | 9052 | 18171 | -1.584 | -0.3477 | Yes | ||
| 26 | MGST1 | 17254 | 18229 | -1.667 | -0.2418 | Yes | ||
| 27 | GPX4 | 9038 | 18324 | -1.829 | -0.1272 | Yes | ||
| 28 | MGST3 | 13771 12349 | 18471 | -2.184 | 0.0078 | Yes |

