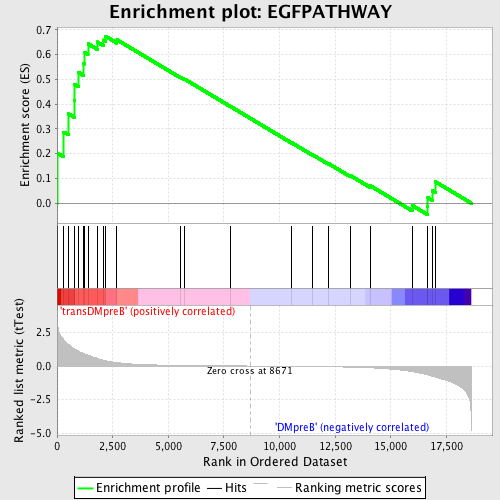
Profile of the Running ES Score & Positions of GeneSet Members on the Rank Ordered List
| Dataset | Set_04_transDMpreB_versus_DMpreB.phenotype_transDMpreB_versus_DMpreB.cls #transDMpreB_versus_DMpreB.phenotype_transDMpreB_versus_DMpreB.cls #transDMpreB_versus_DMpreB_repos |
| Phenotype | phenotype_transDMpreB_versus_DMpreB.cls#transDMpreB_versus_DMpreB_repos |
| Upregulated in class | transDMpreB |
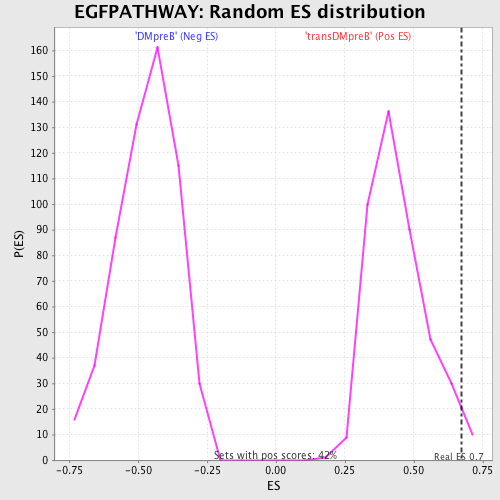
| GeneSet | EGFPATHWAY |
| Enrichment Score (ES) | 0.67467904 |
| Normalized Enrichment Score (NES) | 1.5263283 |
| Nominal p-value | 0.023640662 |
| FDR q-value | 0.3220203 |
| FWER p-Value | 0.979 |
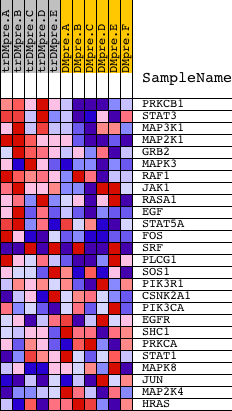
| PROBE | DESCRIPTION (from dataset) | GENE SYMBOL | GENE_TITLE | RANK IN GENE LIST | RANK METRIC SCORE | RUNNING ES | CORE ENRICHMENT | |
|---|---|---|---|---|---|---|---|---|
| 1 | PRKCB1 | 1693 9574 | 2 | 3.865 | 0.2027 | Yes | ||
| 2 | STAT3 | 5525 9906 | 302 | 1.915 | 0.2871 | Yes | ||
| 3 | MAP3K1 | 21348 | 512 | 1.620 | 0.3608 | Yes | ||
| 4 | MAP2K1 | 19082 | 767 | 1.285 | 0.4146 | Yes | ||
| 5 | GRB2 | 20149 | 792 | 1.266 | 0.4797 | Yes | ||
| 6 | MAPK3 | 6458 11170 | 961 | 1.090 | 0.5279 | Yes | ||
| 7 | RAF1 | 17035 | 1186 | 0.942 | 0.5653 | Yes | ||
| 8 | JAK1 | 15827 | 1249 | 0.894 | 0.6089 | Yes | ||
| 9 | RASA1 | 10174 | 1390 | 0.808 | 0.6438 | Yes | ||
| 10 | EGF | 15169 | 1801 | 0.561 | 0.6512 | Yes | ||
| 11 | STAT5A | 20664 | 2075 | 0.430 | 0.6590 | Yes | ||
| 12 | FOS | 21202 | 2168 | 0.392 | 0.6747 | Yes | ||
| 13 | SRF | 22961 1597 | 2690 | 0.252 | 0.6599 | No | ||
| 14 | PLCG1 | 14753 | 5539 | 0.045 | 0.5090 | No | ||
| 15 | SOS1 | 5476 | 5727 | 0.041 | 0.5012 | No | ||
| 16 | PIK3R1 | 3170 | 7780 | 0.010 | 0.3913 | No | ||
| 17 | CSNK2A1 | 14797 | 10544 | -0.024 | 0.2440 | No | ||
| 18 | PIK3CA | 9562 | 11493 | -0.039 | 0.1950 | No | ||
| 19 | EGFR | 1329 20944 | 12205 | -0.054 | 0.1596 | No | ||
| 20 | SHC1 | 9813 9812 5430 | 13187 | -0.085 | 0.1113 | No | ||
| 21 | PRKCA | 20174 | 14071 | -0.131 | 0.0707 | No | ||
| 22 | STAT1 | 3936 5524 | 15957 | -0.419 | -0.0087 | No | ||
| 23 | MAPK8 | 6459 | 16644 | -0.646 | -0.0117 | No | ||
| 24 | JUN | 15832 | 16667 | -0.656 | 0.0216 | No | ||
| 25 | MAP2K4 | 20405 | 16860 | -0.753 | 0.0507 | No | ||
| 26 | HRAS | 4868 | 17006 | -0.832 | 0.0866 | No |