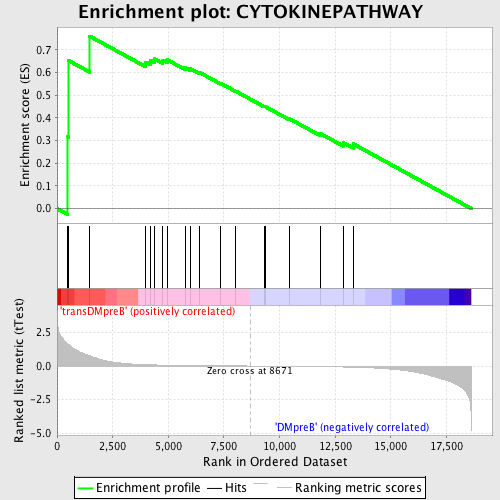
Profile of the Running ES Score & Positions of GeneSet Members on the Rank Ordered List
| Dataset | Set_04_transDMpreB_versus_DMpreB.phenotype_transDMpreB_versus_DMpreB.cls #transDMpreB_versus_DMpreB.phenotype_transDMpreB_versus_DMpreB.cls #transDMpreB_versus_DMpreB_repos |
| Phenotype | phenotype_transDMpreB_versus_DMpreB.cls#transDMpreB_versus_DMpreB_repos |
| Upregulated in class | transDMpreB |
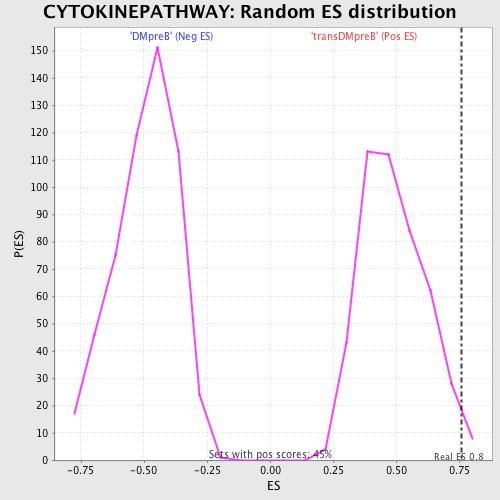
| GeneSet | CYTOKINEPATHWAY |
| Enrichment Score (ES) | 0.760393 |
| Normalized Enrichment Score (NES) | 1.5542494 |
| Nominal p-value | 0.017621145 |
| FDR q-value | 0.32240734 |
| FWER p-Value | 0.927 |
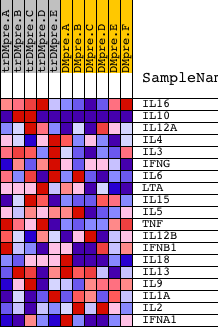
| PROBE | DESCRIPTION (from dataset) | GENE SYMBOL | GENE_TITLE | RANK IN GENE LIST | RANK METRIC SCORE | RUNNING ES | CORE ENRICHMENT | |
|---|---|---|---|---|---|---|---|---|
| 1 | IL16 | 9171 | 484 | 1.647 | 0.3161 | Yes | ||
| 2 | IL10 | 14145 1510 1553 22902 | 504 | 1.628 | 0.6533 | Yes | ||
| 3 | IL12A | 4913 | 1462 | 0.763 | 0.7604 | Yes | ||
| 4 | IL4 | 9174 | 3984 | 0.103 | 0.6463 | No | ||
| 5 | IL3 | 20453 | 4209 | 0.089 | 0.6527 | No | ||
| 6 | IFNG | 19869 | 4390 | 0.081 | 0.6597 | No | ||
| 7 | IL6 | 16895 | 4753 | 0.067 | 0.6541 | No | ||
| 8 | LTA | 23003 | 4950 | 0.060 | 0.6561 | No | ||
| 9 | IL15 | 18826 3801 | 5764 | 0.040 | 0.6208 | No | ||
| 10 | IL5 | 20884 10220 | 5994 | 0.036 | 0.6159 | No | ||
| 11 | TNF | 23004 | 6399 | 0.029 | 0.6003 | No | ||
| 12 | IL12B | 20918 | 7350 | 0.016 | 0.5525 | No | ||
| 13 | IFNB1 | 15846 | 8029 | 0.007 | 0.5175 | No | ||
| 14 | IL18 | 9172 | 9316 | -0.008 | 0.4500 | No | ||
| 15 | IL13 | 20461 | 9345 | -0.008 | 0.4503 | No | ||
| 16 | IL9 | 21444 | 10438 | -0.023 | 0.3963 | No | ||
| 17 | IL1A | 4915 | 11826 | -0.045 | 0.3311 | No | ||
| 18 | IL2 | 15354 | 12873 | -0.073 | 0.2901 | No | ||
| 19 | IFNA1 | 9147 | 13306 | -0.090 | 0.2855 | No |