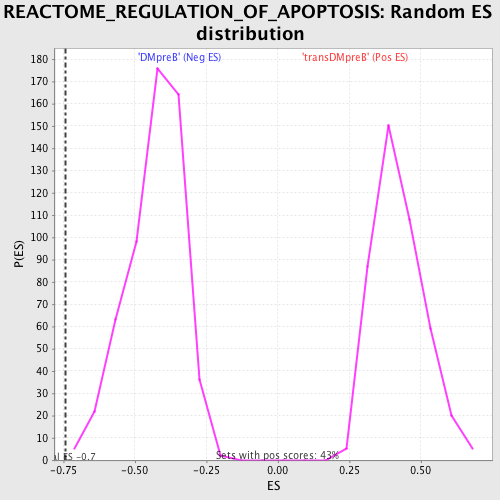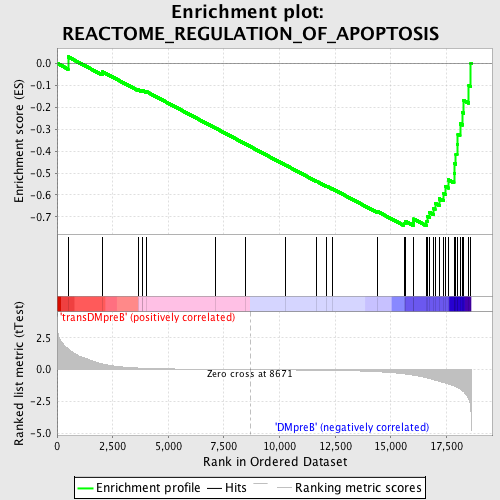
Profile of the Running ES Score & Positions of GeneSet Members on the Rank Ordered List
| Dataset | Set_04_transDMpreB_versus_DMpreB.phenotype_transDMpreB_versus_DMpreB.cls #transDMpreB_versus_DMpreB.phenotype_transDMpreB_versus_DMpreB.cls #transDMpreB_versus_DMpreB_repos |
| Phenotype | phenotype_transDMpreB_versus_DMpreB.cls#transDMpreB_versus_DMpreB_repos |
| Upregulated in class | DMpreB |
| GeneSet | REACTOME_REGULATION_OF_APOPTOSIS |
| Enrichment Score (ES) | -0.7413968 |
| Normalized Enrichment Score (NES) | -1.7301574 |
| Nominal p-value | 0.0017667845 |
| FDR q-value | 0.007808053 |
| FWER p-Value | 0.112 |
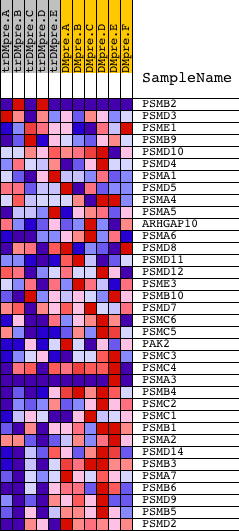
| PROBE | DESCRIPTION (from dataset) | GENE SYMBOL | GENE_TITLE | RANK IN GENE LIST | RANK METRIC SCORE | RUNNING ES | CORE ENRICHMENT | |
|---|---|---|---|---|---|---|---|---|
| 1 | PSMB2 | 2324 16078 | 494 | 1.634 | 0.0294 | No | ||
| 2 | PSMD3 | 5803 | 2030 | 0.446 | -0.0379 | No | ||
| 3 | PSME1 | 5300 9637 | 3639 | 0.127 | -0.1201 | No | ||
| 4 | PSMB9 | 23021 | 3824 | 0.113 | -0.1261 | No | ||
| 5 | PSMD10 | 2578 2597 24046 | 3855 | 0.111 | -0.1239 | No | ||
| 6 | PSMD4 | 15251 | 4024 | 0.100 | -0.1295 | No | ||
| 7 | PSMA1 | 1627 17669 | 7105 | 0.019 | -0.2946 | No | ||
| 8 | PSMD5 | 2774 14612 | 8474 | 0.002 | -0.3682 | No | ||
| 9 | PSMA4 | 11179 | 10263 | -0.020 | -0.4637 | No | ||
| 10 | PSMA5 | 6464 | 11660 | -0.042 | -0.5374 | No | ||
| 11 | ARHGAP10 | 3808 18836 | 12109 | -0.051 | -0.5598 | No | ||
| 12 | PSMA6 | 21270 | 12356 | -0.058 | -0.5710 | No | ||
| 13 | PSMD8 | 7166 | 14395 | -0.160 | -0.6752 | No | ||
| 14 | PSMD11 | 12772 7600 | 15592 | -0.330 | -0.7283 | Yes | ||
| 15 | PSMD12 | 20621 | 15664 | -0.347 | -0.7202 | Yes | ||
| 16 | PSME3 | 20657 | 16006 | -0.433 | -0.7237 | Yes | ||
| 17 | PSMB10 | 5299 18761 | 16020 | -0.436 | -0.7095 | Yes | ||
| 18 | PSMD7 | 18752 3825 | 16614 | -0.638 | -0.7195 | Yes | ||
| 19 | PSMC6 | 7379 | 16655 | -0.652 | -0.6993 | Yes | ||
| 20 | PSMC5 | 1348 20624 | 16737 | -0.692 | -0.6800 | Yes | ||
| 21 | PAK2 | 10310 5875 | 16924 | -0.783 | -0.6631 | Yes | ||
| 22 | PSMC3 | 9636 | 16989 | -0.820 | -0.6384 | Yes | ||
| 23 | PSMC4 | 2141 17915 | 17184 | -0.914 | -0.6175 | Yes | ||
| 24 | PSMA3 | 9632 5298 | 17363 | -1.000 | -0.5928 | Yes | ||
| 25 | PSMB4 | 15252 | 17460 | -1.042 | -0.5622 | Yes | ||
| 26 | PSMC2 | 16909 | 17578 | -1.113 | -0.5304 | Yes | ||
| 27 | PSMC1 | 9635 | 17840 | -1.277 | -0.5007 | Yes | ||
| 28 | PSMB1 | 23118 | 17872 | -1.303 | -0.4576 | Yes | ||
| 29 | PSMA2 | 9631 | 17925 | -1.349 | -0.4142 | Yes | ||
| 30 | PSMD14 | 15005 | 17976 | -1.387 | -0.3693 | Yes | ||
| 31 | PSMB3 | 11180 | 18016 | -1.424 | -0.3226 | Yes | ||
| 32 | PSMA7 | 14318 | 18110 | -1.516 | -0.2756 | Yes | ||
| 33 | PSMB6 | 9634 | 18218 | -1.647 | -0.2249 | Yes | ||
| 34 | PSMD9 | 3461 7393 | 18267 | -1.723 | -0.1684 | Yes | ||
| 35 | PSMB5 | 9633 | 18507 | -2.296 | -0.1025 | Yes | ||
| 36 | PSMD2 | 10137 5724 | 18598 | -3.160 | 0.0010 | Yes |