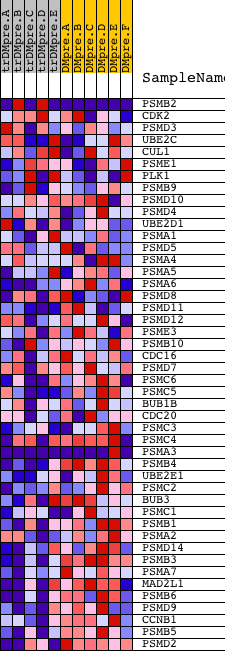
Profile of the Running ES Score & Positions of GeneSet Members on the Rank Ordered List
| Dataset | Set_04_transDMpreB_versus_DMpreB.phenotype_transDMpreB_versus_DMpreB.cls #transDMpreB_versus_DMpreB.phenotype_transDMpreB_versus_DMpreB.cls #transDMpreB_versus_DMpreB_repos |
| Phenotype | phenotype_transDMpreB_versus_DMpreB.cls#transDMpreB_versus_DMpreB_repos |
| Upregulated in class | DMpreB |
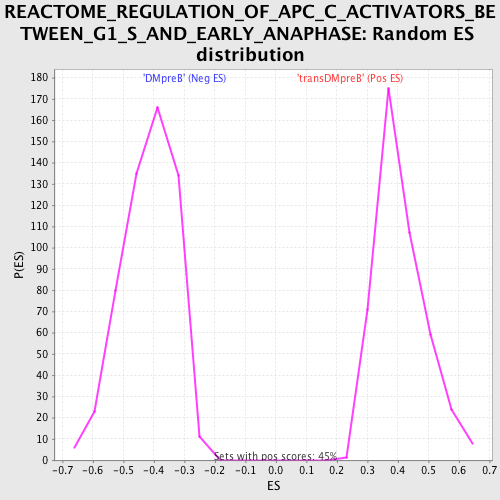
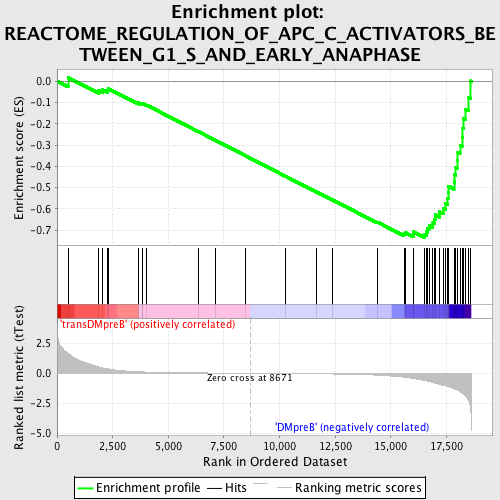
| GeneSet | REACTOME_REGULATION_OF_APC_C_ACTIVATORS_BETWEEN_G1_S_AND_EARLY_ANAPHASE |
| Enrichment Score (ES) | -0.73378235 |
| Normalized Enrichment Score (NES) | -1.7645675 |
| Nominal p-value | 0.0 |
| FDR q-value | 0.0065826476 |
| FWER p-Value | 0.044 |
| PROBE | DESCRIPTION (from dataset) | GENE SYMBOL | GENE_TITLE | RANK IN GENE LIST | RANK METRIC SCORE | RUNNING ES | CORE ENRICHMENT | |
|---|---|---|---|---|---|---|---|---|
| 1 | PSMB2 | 2324 16078 | 494 | 1.634 | 0.0168 | No | ||
| 2 | CDK2 | 3438 3373 19592 3322 | 1865 | 0.529 | -0.0429 | No | ||
| 3 | PSMD3 | 5803 | 2030 | 0.446 | -0.0398 | No | ||
| 4 | UBE2C | 12714 | 2258 | 0.366 | -0.0423 | No | ||
| 5 | CUL1 | 17462 | 2309 | 0.352 | -0.0356 | No | ||
| 6 | PSME1 | 5300 9637 | 3639 | 0.127 | -0.1038 | No | ||
| 7 | PLK1 | 9590 5266 | 3640 | 0.127 | -0.1005 | No | ||
| 8 | PSMB9 | 23021 | 3824 | 0.113 | -0.1073 | No | ||
| 9 | PSMD10 | 2578 2597 24046 | 3855 | 0.111 | -0.1060 | No | ||
| 10 | PSMD4 | 15251 | 4024 | 0.100 | -0.1124 | No | ||
| 11 | UBE2D1 | 19738 | 6351 | 0.030 | -0.2368 | No | ||
| 12 | PSMA1 | 1627 17669 | 7105 | 0.019 | -0.2769 | No | ||
| 13 | PSMD5 | 2774 14612 | 8474 | 0.002 | -0.3505 | No | ||
| 14 | PSMA4 | 11179 | 10263 | -0.020 | -0.4462 | No | ||
| 15 | PSMA5 | 6464 | 11660 | -0.042 | -0.5202 | No | ||
| 16 | PSMA6 | 21270 | 12356 | -0.058 | -0.5561 | No | ||
| 17 | PSMD8 | 7166 | 14395 | -0.160 | -0.6616 | No | ||
| 18 | PSMD11 | 12772 7600 | 15592 | -0.330 | -0.7173 | No | ||
| 19 | PSMD12 | 20621 | 15664 | -0.347 | -0.7119 | No | ||
| 20 | PSME3 | 20657 | 16006 | -0.433 | -0.7187 | Yes | ||
| 21 | PSMB10 | 5299 18761 | 16020 | -0.436 | -0.7078 | Yes | ||
| 22 | CDC16 | 18676 | 16503 | -0.589 | -0.7181 | Yes | ||
| 23 | PSMD7 | 18752 3825 | 16614 | -0.638 | -0.7071 | Yes | ||
| 24 | PSMC6 | 7379 | 16655 | -0.652 | -0.6919 | Yes | ||
| 25 | PSMC5 | 1348 20624 | 16737 | -0.692 | -0.6779 | Yes | ||
| 26 | BUB1B | 14908 | 16892 | -0.766 | -0.6658 | Yes | ||
| 27 | CDC20 | 8421 8422 4227 | 16956 | -0.802 | -0.6478 | Yes | ||
| 28 | PSMC3 | 9636 | 16989 | -0.820 | -0.6278 | Yes | ||
| 29 | PSMC4 | 2141 17915 | 17184 | -0.914 | -0.6139 | Yes | ||
| 30 | PSMA3 | 9632 5298 | 17363 | -1.000 | -0.5969 | Yes | ||
| 31 | PSMB4 | 15252 | 17460 | -1.042 | -0.5743 | Yes | ||
| 32 | UBE2E1 | 10243 5817 | 17541 | -1.082 | -0.5499 | Yes | ||
| 33 | PSMC2 | 16909 | 17578 | -1.113 | -0.5222 | Yes | ||
| 34 | BUB3 | 18045 | 17586 | -1.118 | -0.4929 | Yes | ||
| 35 | PSMC1 | 9635 | 17840 | -1.277 | -0.4725 | Yes | ||
| 36 | PSMB1 | 23118 | 17872 | -1.303 | -0.4395 | Yes | ||
| 37 | PSMA2 | 9631 | 17925 | -1.349 | -0.4065 | Yes | ||
| 38 | PSMD14 | 15005 | 17976 | -1.387 | -0.3723 | Yes | ||
| 39 | PSMB3 | 11180 | 18016 | -1.424 | -0.3365 | Yes | ||
| 40 | PSMA7 | 14318 | 18110 | -1.516 | -0.3012 | Yes | ||
| 41 | MAD2L1 | 17422 | 18202 | -1.621 | -0.2630 | Yes | ||
| 42 | PSMB6 | 9634 | 18218 | -1.647 | -0.2200 | Yes | ||
| 43 | PSMD9 | 3461 7393 | 18267 | -1.723 | -0.1768 | Yes | ||
| 44 | CCNB1 | 11201 21362 | 18360 | -1.891 | -0.1314 | Yes | ||
| 45 | PSMB5 | 9633 | 18507 | -2.296 | -0.0782 | Yes | ||
| 46 | PSMD2 | 10137 5724 | 18598 | -3.160 | 0.0010 | Yes |