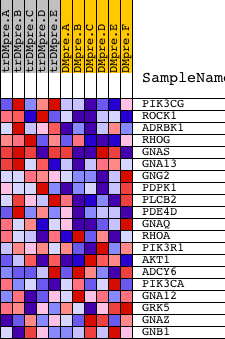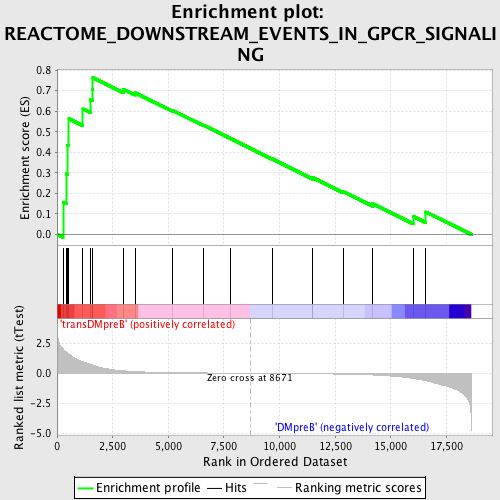
Profile of the Running ES Score & Positions of GeneSet Members on the Rank Ordered List
| Dataset | Set_04_transDMpreB_versus_DMpreB.phenotype_transDMpreB_versus_DMpreB.cls #transDMpreB_versus_DMpreB.phenotype_transDMpreB_versus_DMpreB.cls #transDMpreB_versus_DMpreB_repos |
| Phenotype | phenotype_transDMpreB_versus_DMpreB.cls#transDMpreB_versus_DMpreB_repos |
| Upregulated in class | transDMpreB |
| GeneSet | REACTOME_DOWNSTREAM_EVENTS_IN_GPCR_SIGNALING |
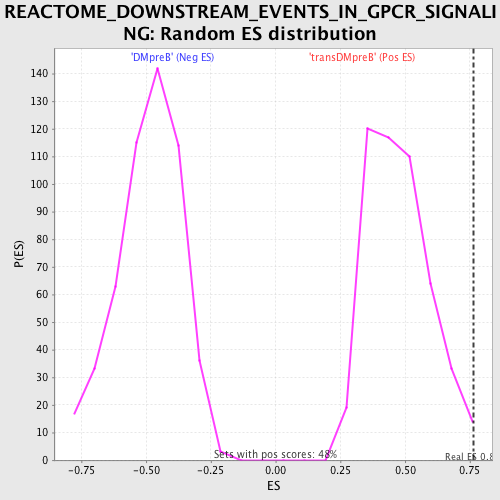
| Enrichment Score (ES) | 0.7633564 |
| Normalized Enrichment Score (NES) | 1.5970925 |
| Nominal p-value | 0.016771488 |
| FDR q-value | 0.23038897 |
| FWER p-Value | 0.91 |
| PROBE | DESCRIPTION (from dataset) | GENE SYMBOL | GENE_TITLE | RANK IN GENE LIST | RANK METRIC SCORE | RUNNING ES | CORE ENRICHMENT | |
|---|---|---|---|---|---|---|---|---|
| 1 | PIK3CG | 6635 | 265 | 2.027 | 0.1564 | Yes | ||
| 2 | ROCK1 | 5386 | 409 | 1.746 | 0.2957 | Yes | ||
| 3 | ADRBK1 | 23960 | 454 | 1.683 | 0.4350 | Yes | ||
| 4 | RHOG | 17727 | 533 | 1.576 | 0.5635 | Yes | ||
| 5 | GNAS | 9025 2963 2752 | 1162 | 0.961 | 0.6107 | Yes | ||
| 6 | GNA13 | 20617 | 1502 | 0.738 | 0.6546 | Yes | ||
| 7 | GNG2 | 4790 | 1593 | 0.685 | 0.7074 | Yes | ||
| 8 | PDPK1 | 23097 | 1610 | 0.675 | 0.7634 | Yes | ||
| 9 | PLCB2 | 5262 | 2988 | 0.201 | 0.7062 | No | ||
| 10 | PDE4D | 10722 6235 | 3504 | 0.138 | 0.6901 | No | ||
| 11 | GNAQ | 4786 23909 3685 | 5182 | 0.054 | 0.6045 | No | ||
| 12 | RHOA | 8624 4409 4410 | 6560 | 0.027 | 0.5327 | No | ||
| 13 | PIK3R1 | 3170 | 7780 | 0.010 | 0.4680 | No | ||
| 14 | AKT1 | 8568 | 9662 | -0.013 | 0.3679 | No | ||
| 15 | ADCY6 | 22139 2283 8551 | 11490 | -0.039 | 0.2729 | No | ||
| 16 | PIK3CA | 9562 | 11493 | -0.039 | 0.2761 | No | ||
| 17 | GNA12 | 9023 | 12854 | -0.073 | 0.2091 | No | ||
| 18 | GRK5 | 9036 23814 | 14178 | -0.140 | 0.1497 | No | ||
| 19 | GNAZ | 71 | 16003 | -0.431 | 0.0879 | No | ||
| 20 | GNB1 | 15967 | 16578 | -0.624 | 0.1096 | No |