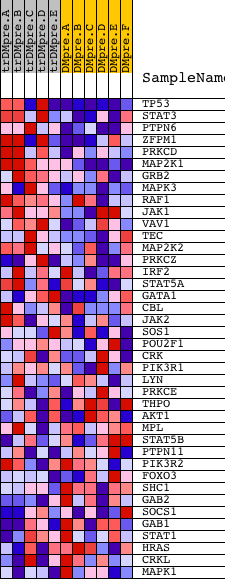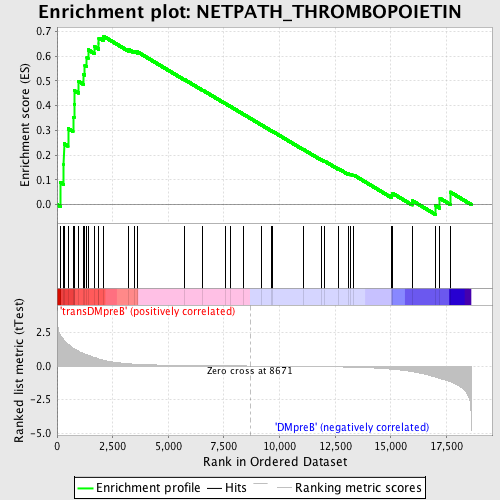
Profile of the Running ES Score & Positions of GeneSet Members on the Rank Ordered List
| Dataset | Set_04_transDMpreB_versus_DMpreB.phenotype_transDMpreB_versus_DMpreB.cls #transDMpreB_versus_DMpreB.phenotype_transDMpreB_versus_DMpreB.cls #transDMpreB_versus_DMpreB_repos |
| Phenotype | phenotype_transDMpreB_versus_DMpreB.cls#transDMpreB_versus_DMpreB_repos |
| Upregulated in class | transDMpreB |
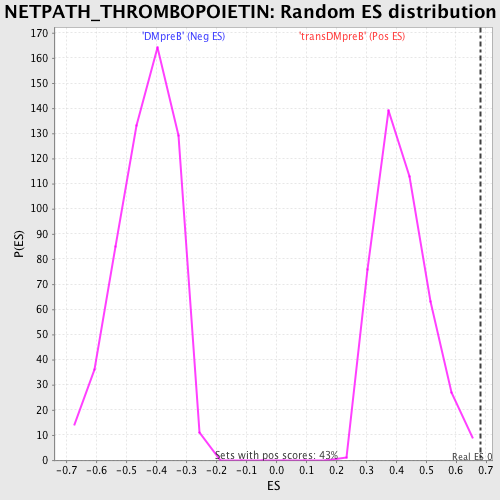
| GeneSet | NETPATH_THROMBOPOIETIN |
| Enrichment Score (ES) | 0.68055165 |
| Normalized Enrichment Score (NES) | 1.625858 |
| Nominal p-value | 0.004672897 |
| FDR q-value | 0.1888911 |
| FWER p-Value | 0.789 |
| PROBE | DESCRIPTION (from dataset) | GENE SYMBOL | GENE_TITLE | RANK IN GENE LIST | RANK METRIC SCORE | RUNNING ES | CORE ENRICHMENT | |
|---|---|---|---|---|---|---|---|---|
| 1 | TP53 | 20822 | 149 | 2.251 | 0.0894 | Yes | ||
| 2 | STAT3 | 5525 9906 | 302 | 1.915 | 0.1641 | Yes | ||
| 3 | PTPN6 | 17002 | 309 | 1.905 | 0.2462 | Yes | ||
| 4 | ZFPM1 | 18439 | 490 | 1.637 | 0.3074 | Yes | ||
| 5 | PRKCD | 21897 | 716 | 1.338 | 0.3532 | Yes | ||
| 6 | MAP2K1 | 19082 | 767 | 1.285 | 0.4061 | Yes | ||
| 7 | GRB2 | 20149 | 792 | 1.266 | 0.4596 | Yes | ||
| 8 | MAPK3 | 6458 11170 | 961 | 1.090 | 0.4977 | Yes | ||
| 9 | RAF1 | 17035 | 1186 | 0.942 | 0.5265 | Yes | ||
| 10 | JAK1 | 15827 | 1249 | 0.894 | 0.5618 | Yes | ||
| 11 | VAV1 | 23173 | 1340 | 0.841 | 0.5934 | Yes | ||
| 12 | TEC | 16514 | 1394 | 0.805 | 0.6254 | Yes | ||
| 13 | MAP2K2 | 19933 | 1669 | 0.648 | 0.6387 | Yes | ||
| 14 | PRKCZ | 5260 | 1877 | 0.520 | 0.6500 | Yes | ||
| 15 | IRF2 | 18621 | 1878 | 0.519 | 0.6725 | Yes | ||
| 16 | STAT5A | 20664 | 2075 | 0.430 | 0.6806 | Yes | ||
| 17 | GATA1 | 24196 | 3216 | 0.169 | 0.6265 | No | ||
| 18 | CBL | 19154 | 3468 | 0.140 | 0.6191 | No | ||
| 19 | JAK2 | 23893 9197 3706 | 3607 | 0.130 | 0.6173 | No | ||
| 20 | SOS1 | 5476 | 5727 | 0.041 | 0.5050 | No | ||
| 21 | POU2F1 | 5275 3989 4065 4010 | 6540 | 0.027 | 0.4625 | No | ||
| 22 | CRK | 4559 1249 | 7549 | 0.013 | 0.4088 | No | ||
| 23 | PIK3R1 | 3170 | 7780 | 0.010 | 0.3968 | No | ||
| 24 | LYN | 16281 | 8372 | 0.004 | 0.3652 | No | ||
| 25 | PRKCE | 9575 | 9170 | -0.006 | 0.3225 | No | ||
| 26 | THPO | 22636 | 9641 | -0.012 | 0.2977 | No | ||
| 27 | AKT1 | 8568 | 9662 | -0.013 | 0.2972 | No | ||
| 28 | MPL | 15780 | 11080 | -0.032 | 0.2223 | No | ||
| 29 | STAT5B | 20222 | 11863 | -0.046 | 0.1822 | No | ||
| 30 | PTPN11 | 5326 16391 9660 | 12023 | -0.049 | 0.1758 | No | ||
| 31 | PIK3R2 | 18850 | 12662 | -0.067 | 0.1443 | No | ||
| 32 | FOXO3 | 19782 3402 | 13083 | -0.081 | 0.1252 | No | ||
| 33 | SHC1 | 9813 9812 5430 | 13187 | -0.085 | 0.1234 | No | ||
| 34 | GAB2 | 1821 18184 2025 | 13330 | -0.091 | 0.1197 | No | ||
| 35 | SOCS1 | 4522 | 15021 | -0.231 | 0.0387 | No | ||
| 36 | GAB1 | 18828 | 15058 | -0.235 | 0.0469 | No | ||
| 37 | STAT1 | 3936 5524 | 15957 | -0.419 | 0.0167 | No | ||
| 38 | HRAS | 4868 | 17006 | -0.832 | -0.0037 | No | ||
| 39 | CRKL | 4560 | 17208 | -0.926 | 0.0255 | No | ||
| 40 | MAPK1 | 1642 11167 | 17667 | -1.160 | 0.0511 | No |