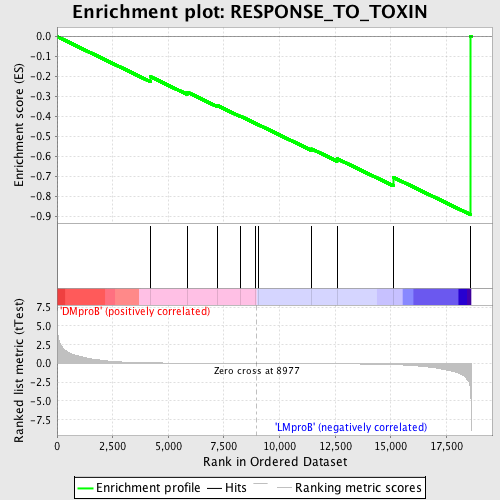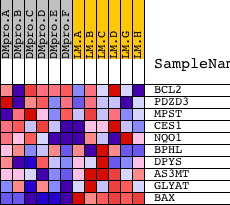
Profile of the Running ES Score & Positions of GeneSet Members on the Rank Ordered List
| Dataset | Set_04_DMproB_versus_LMproB.phenotype_DMproB_versus_LMproB.cls #DMproB_versus_LMproB |
| Phenotype | phenotype_DMproB_versus_LMproB.cls#DMproB_versus_LMproB |
| Upregulated in class | LMproB |
| GeneSet | RESPONSE_TO_TOXIN |
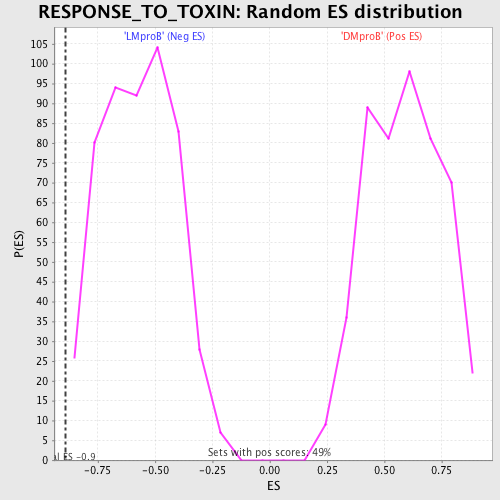
| Enrichment Score (ES) | -0.8899782 |
| Normalized Enrichment Score (NES) | -1.5613432 |
| Nominal p-value | 0.0019455253 |
| FDR q-value | 0.41545632 |
| FWER p-Value | 0.979 |

| PROBE | DESCRIPTION (from dataset) | GENE SYMBOL | GENE_TITLE | RANK IN GENE LIST | RANK METRIC SCORE | RUNNING ES | CORE ENRICHMENT | |
|---|---|---|---|---|---|---|---|---|
| 1 | BCL2 | 8651 3928 13864 4435 981 4062 13863 4027 | 4210 | 0.085 | -0.2014 | No | ||
| 2 | PDZD3 | 19153 | 5842 | 0.040 | -0.2774 | No | ||
| 3 | MPST | 22434 | 7223 | 0.020 | -0.3459 | No | ||
| 4 | CES1 | 18789 | 8264 | 0.007 | -0.3996 | No | ||
| 5 | NQO1 | 18754 3836 | 8903 | 0.001 | -0.4337 | No | ||
| 6 | BPHL | 21669 | 9064 | -0.001 | -0.4420 | No | ||
| 7 | DPYS | 22305 | 11445 | -0.026 | -0.5622 | No | ||
| 8 | AS3MT | 23832 12185 | 12581 | -0.043 | -0.6106 | No | ||
| 9 | GLYAT | 4205 | 15119 | -0.146 | -0.7046 | Yes | ||
| 10 | BAX | 17832 | 18570 | -3.065 | 0.0025 | Yes |

