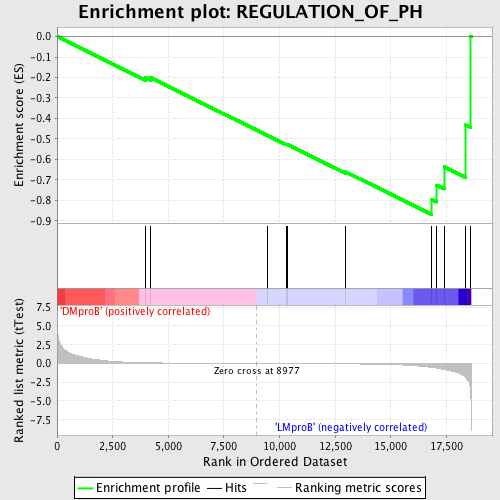
Profile of the Running ES Score & Positions of GeneSet Members on the Rank Ordered List
| Dataset | Set_04_DMproB_versus_LMproB.phenotype_DMproB_versus_LMproB.cls #DMproB_versus_LMproB |
| Phenotype | phenotype_DMproB_versus_LMproB.cls#DMproB_versus_LMproB |
| Upregulated in class | LMproB |
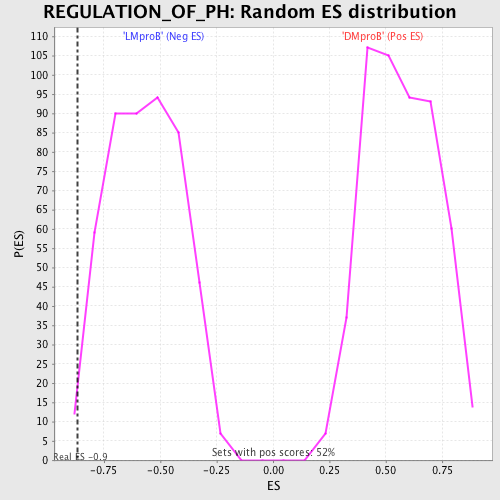
| GeneSet | REGULATION_OF_PH |
| Enrichment Score (ES) | -0.86868316 |
| Normalized Enrichment Score (NES) | -1.5278087 |
| Nominal p-value | 0.010351967 |
| FDR q-value | 0.41604474 |
| FWER p-Value | 0.998 |
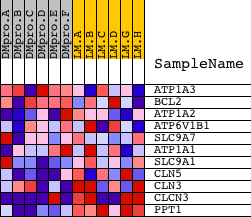
| PROBE | DESCRIPTION (from dataset) | GENE SYMBOL | GENE_TITLE | RANK IN GENE LIST | RANK METRIC SCORE | RUNNING ES | CORE ENRICHMENT | |
|---|---|---|---|---|---|---|---|---|
| 1 | ATP1A3 | 21 | 3964 | 0.098 | -0.1998 | No | ||
| 2 | BCL2 | 8651 3928 13864 4435 981 4062 13863 4027 | 4210 | 0.085 | -0.2014 | No | ||
| 3 | ATP1A2 | 13751 | 9465 | -0.005 | -0.4831 | No | ||
| 4 | ATP6V1B1 | 8499 | 10327 | -0.013 | -0.5275 | No | ||
| 5 | SLC9A7 | 24177 | 10346 | -0.013 | -0.5267 | No | ||
| 6 | ATP1A1 | 15222 | 12973 | -0.050 | -0.6610 | No | ||
| 7 | SLC9A1 | 16053 | 16838 | -0.531 | -0.7967 | Yes | ||
| 8 | CLN5 | 21943 | 17045 | -0.608 | -0.7252 | Yes | ||
| 9 | CLN3 | 17635 | 17395 | -0.797 | -0.6358 | Yes | ||
| 10 | CLCN3 | 8745 3782 3893 4524 | 18373 | -1.890 | -0.4318 | Yes | ||
| 11 | PPT1 | 9613 | 18579 | -3.277 | 0.0020 | Yes |