Profile of the Running ES Score & Positions of GeneSet Members on the Rank Ordered List
| Dataset | Set_04_DMproB_versus_LMproB.phenotype_DMproB_versus_LMproB.cls #DMproB_versus_LMproB |
| Phenotype | phenotype_DMproB_versus_LMproB.cls#DMproB_versus_LMproB |
| Upregulated in class | DMproB |
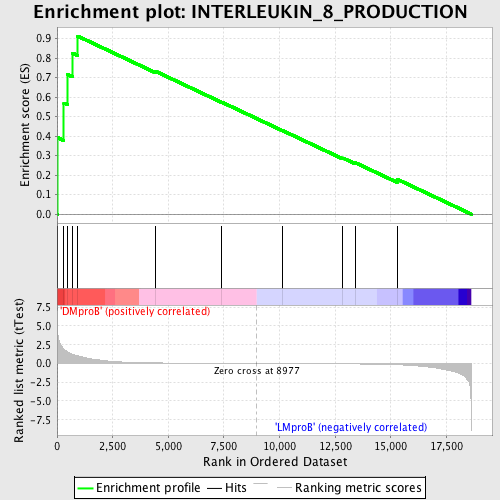
| GeneSet | INTERLEUKIN_8_PRODUCTION |
| Enrichment Score (ES) | 0.9129165 |
| Normalized Enrichment Score (NES) | 1.5689551 |
| Nominal p-value | 0.003968254 |
| FDR q-value | 0.18221124 |
| FWER p-Value | 0.986 |
| PROBE | DESCRIPTION (from dataset) | GENE SYMBOL | GENE_TITLE | RANK IN GENE LIST | RANK METRIC SCORE | RUNNING ES | CORE ENRICHMENT | |
|---|---|---|---|---|---|---|---|---|
| 1 | PRG3 | 14971 | 32 | 3.943 | 0.3921 | Yes | ||
| 2 | BCL3 | 8654 | 305 | 1.927 | 0.5699 | Yes | ||
| 3 | BCL10 | 15397 | 471 | 1.553 | 0.7161 | Yes | ||
| 4 | NOD1 | 17141 | 681 | 1.214 | 0.8261 | Yes | ||
| 5 | ELA2 | 11925 8893 | 927 | 1.001 | 0.9129 | Yes | ||
| 6 | TLR8 | 9308 | 4434 | 0.076 | 0.7321 | No | ||
| 7 | TLR7 | 24004 | 7409 | 0.017 | 0.5740 | No | ||
| 8 | IL17F | 13992 | 10139 | -0.011 | 0.4284 | No | ||
| 9 | TLR4 | 2329 10191 5770 | 12842 | -0.048 | 0.2880 | No | ||
| 10 | CALCA | 4470 | 13398 | -0.061 | 0.2642 | No | ||
| 11 | APOA2 | 8615 4044 | 15285 | -0.162 | 0.1790 | No |

