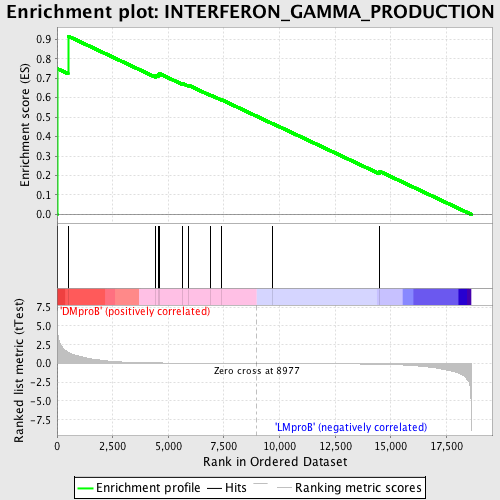
Profile of the Running ES Score & Positions of GeneSet Members on the Rank Ordered List
| Dataset | Set_04_DMproB_versus_LMproB.phenotype_DMproB_versus_LMproB.cls #DMproB_versus_LMproB |
| Phenotype | phenotype_DMproB_versus_LMproB.cls#DMproB_versus_LMproB |
| Upregulated in class | DMproB |
| GeneSet | INTERFERON_GAMMA_PRODUCTION |
| Enrichment Score (ES) | 0.9162171 |
| Normalized Enrichment Score (NES) | 1.6252192 |
| Nominal p-value | 0.0 |
| FDR q-value | 0.0864826 |
| FWER p-Value | 0.745 |
| PROBE | DESCRIPTION (from dataset) | GENE SYMBOL | GENE_TITLE | RANK IN GENE LIST | RANK METRIC SCORE | RUNNING ES | CORE ENRICHMENT | |
|---|---|---|---|---|---|---|---|---|
| 1 | EBI3 | 23193 | 4 | 5.900 | 0.7491 | Yes | ||
| 2 | IL12A | 4913 | 492 | 1.522 | 0.9162 | Yes | ||
| 3 | TLR8 | 9308 | 4434 | 0.076 | 0.7141 | No | ||
| 4 | IL27 | 17636 | 4541 | 0.072 | 0.7176 | No | ||
| 5 | TLR3 | 18884 | 4590 | 0.070 | 0.7239 | No | ||
| 6 | FOXP3 | 9804 5426 | 5650 | 0.044 | 0.6726 | No | ||
| 7 | INHA | 14214 | 5893 | 0.039 | 0.6645 | No | ||
| 8 | TLR9 | 19331 3127 | 6901 | 0.023 | 0.6134 | No | ||
| 9 | TLR7 | 24004 | 7409 | 0.017 | 0.5883 | No | ||
| 10 | IL12B | 20918 | 9683 | -0.007 | 0.4670 | No | ||
| 11 | IL18 | 9172 | 14486 | -0.103 | 0.2220 | No |

