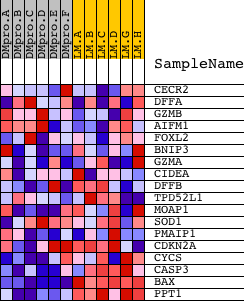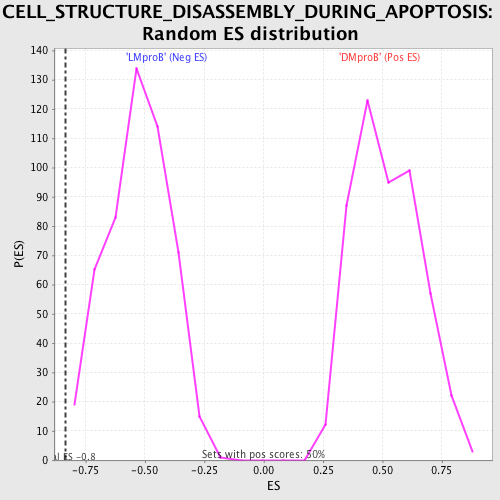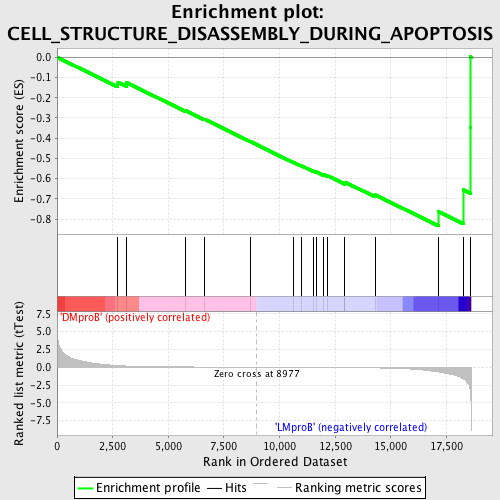
Profile of the Running ES Score & Positions of GeneSet Members on the Rank Ordered List
| Dataset | Set_04_DMproB_versus_LMproB.phenotype_DMproB_versus_LMproB.cls #DMproB_versus_LMproB |
| Phenotype | phenotype_DMproB_versus_LMproB.cls#DMproB_versus_LMproB |
| Upregulated in class | LMproB |
| GeneSet | CELL_STRUCTURE_DISASSEMBLY_DURING_APOPTOSIS |
| Enrichment Score (ES) | -0.833766 |
| Normalized Enrichment Score (NES) | -1.5779815 |
| Nominal p-value | 0.003984064 |
| FDR q-value | 0.3545957 |
| FWER p-Value | 0.955 |
| PROBE | DESCRIPTION (from dataset) | GENE SYMBOL | GENE_TITLE | RANK IN GENE LIST | RANK METRIC SCORE | RUNNING ES | CORE ENRICHMENT | |
|---|---|---|---|---|---|---|---|---|
| 1 | CECR2 | 17304 | 2733 | 0.225 | -0.1230 | No | ||
| 2 | DFFA | 4627 | 3109 | 0.173 | -0.1247 | No | ||
| 3 | GZMB | 21810 | 5765 | 0.041 | -0.2631 | No | ||
| 4 | AIFM1 | 2558 24161 | 6640 | 0.027 | -0.3072 | No | ||
| 5 | FOXL2 | 19345 | 8692 | 0.003 | -0.4172 | No | ||
| 6 | BNIP3 | 17581 | 10620 | -0.016 | -0.5190 | No | ||
| 7 | GZMA | 21343 | 10976 | -0.021 | -0.5359 | No | ||
| 8 | CIDEA | 23529 | 11526 | -0.027 | -0.5626 | No | ||
| 9 | DFFB | 15654 | 11664 | -0.029 | -0.5668 | No | ||
| 10 | TPD52L1 | 3420 19793 | 11959 | -0.033 | -0.5791 | No | ||
| 11 | MOAP1 | 12252 | 12153 | -0.036 | -0.5856 | No | ||
| 12 | SOD1 | 9846 | 12930 | -0.049 | -0.6221 | No | ||
| 13 | PMAIP1 | 23530 12216 7196 | 12936 | -0.049 | -0.6171 | No | ||
| 14 | CDKN2A | 2491 15841 | 14297 | -0.093 | -0.6803 | No | ||
| 15 | CYCS | 8821 | 17152 | -0.657 | -0.7639 | Yes | ||
| 16 | CASP3 | 8693 | 18250 | -1.583 | -0.6546 | Yes | ||
| 17 | BAX | 17832 | 18570 | -3.065 | -0.3460 | Yes | ||
| 18 | PPT1 | 9613 | 18579 | -3.277 | 0.0020 | Yes |