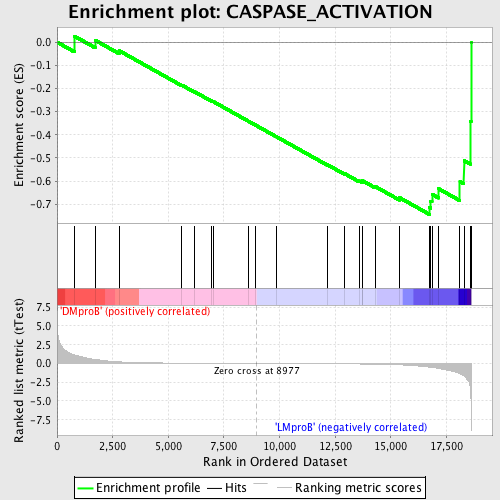
Profile of the Running ES Score & Positions of GeneSet Members on the Rank Ordered List
| Dataset | Set_04_DMproB_versus_LMproB.phenotype_DMproB_versus_LMproB.cls #DMproB_versus_LMproB |
| Phenotype | phenotype_DMproB_versus_LMproB.cls#DMproB_versus_LMproB |
| Upregulated in class | LMproB |
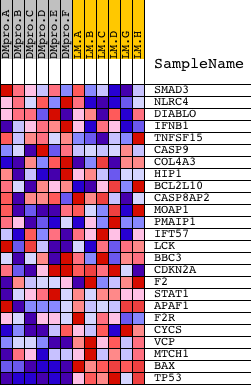
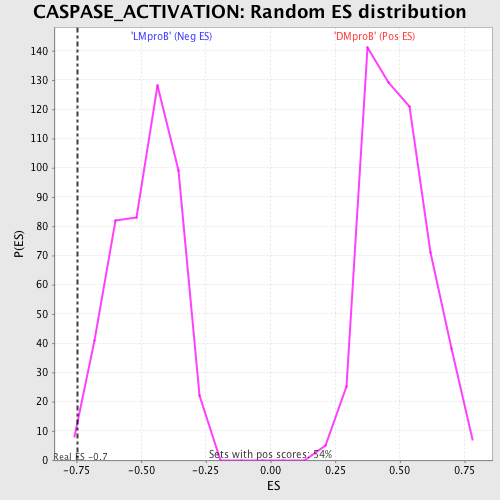
| GeneSet | CASPASE_ACTIVATION |
| Enrichment Score (ES) | -0.74418646 |
| Normalized Enrichment Score (NES) | -1.5480138 |
| Nominal p-value | 0.012958963 |
| FDR q-value | 0.4662353 |
| FWER p-Value | 0.993 |
| PROBE | DESCRIPTION (from dataset) | GENE SYMBOL | GENE_TITLE | RANK IN GENE LIST | RANK METRIC SCORE | RUNNING ES | CORE ENRICHMENT | |
|---|---|---|---|---|---|---|---|---|
| 1 | SMAD3 | 19084 | 775 | 1.120 | 0.0262 | No | ||
| 2 | NLRC4 | 11225 | 1711 | 0.532 | 0.0082 | No | ||
| 3 | DIABLO | 16375 | 2789 | 0.214 | -0.0367 | No | ||
| 4 | IFNB1 | 15846 | 5603 | 0.045 | -0.1853 | No | ||
| 5 | TNFSF15 | 15863 | 6166 | 0.034 | -0.2134 | No | ||
| 6 | CASP9 | 16001 2410 2458 | 6938 | 0.023 | -0.2535 | No | ||
| 7 | COL4A3 | 8766 | 7010 | 0.022 | -0.2560 | No | ||
| 8 | HIP1 | 5676 | 8596 | 0.004 | -0.3410 | No | ||
| 9 | BCL2L10 | 19377 | 8938 | 0.000 | -0.3593 | No | ||
| 10 | CASP8AP2 | 16253 | 9852 | -0.008 | -0.4079 | No | ||
| 11 | MOAP1 | 12252 | 12153 | -0.036 | -0.5294 | No | ||
| 12 | PMAIP1 | 23530 12216 7196 | 12936 | -0.049 | -0.5685 | No | ||
| 13 | IFT57 | 13144 22737 7876 | 13586 | -0.066 | -0.5994 | No | ||
| 14 | LCK | 15746 | 13709 | -0.070 | -0.6017 | No | ||
| 15 | BBC3 | 18382 2044 | 13733 | -0.071 | -0.5986 | No | ||
| 16 | CDKN2A | 2491 15841 | 14297 | -0.093 | -0.6233 | No | ||
| 17 | F2 | 14524 | 15389 | -0.174 | -0.6714 | No | ||
| 18 | STAT1 | 3936 5524 | 16743 | -0.486 | -0.7147 | Yes | ||
| 19 | APAF1 | 8606 | 16795 | -0.511 | -0.6865 | Yes | ||
| 20 | F2R | 21386 | 16852 | -0.536 | -0.6570 | Yes | ||
| 21 | CYCS | 8821 | 17152 | -0.657 | -0.6332 | Yes | ||
| 22 | VCP | 11254 | 18108 | -1.358 | -0.6022 | Yes | ||
| 23 | MTCH1 | 23042 1572 | 18289 | -1.655 | -0.5115 | Yes | ||
| 24 | BAX | 17832 | 18570 | -3.065 | -0.3407 | Yes | ||
| 25 | TP53 | 20822 | 18609 | -5.657 | 0.0004 | Yes |