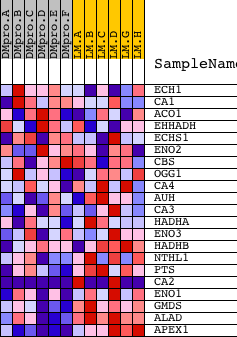
Profile of the Running ES Score & Positions of GeneSet Members on the Rank Ordered List
| Dataset | Set_04_DMproB_versus_LMproB.phenotype_DMproB_versus_LMproB.cls #DMproB_versus_LMproB |
| Phenotype | phenotype_DMproB_versus_LMproB.cls#DMproB_versus_LMproB |
| Upregulated in class | LMproB |
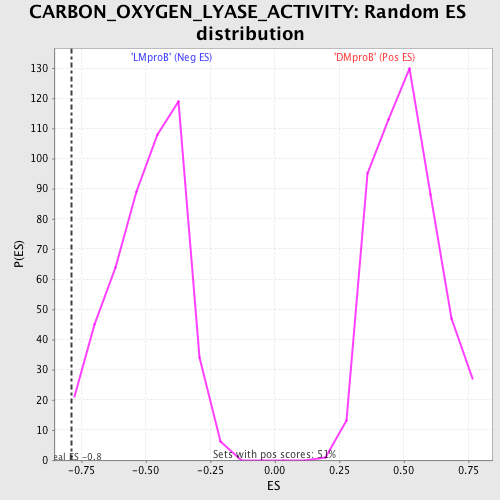
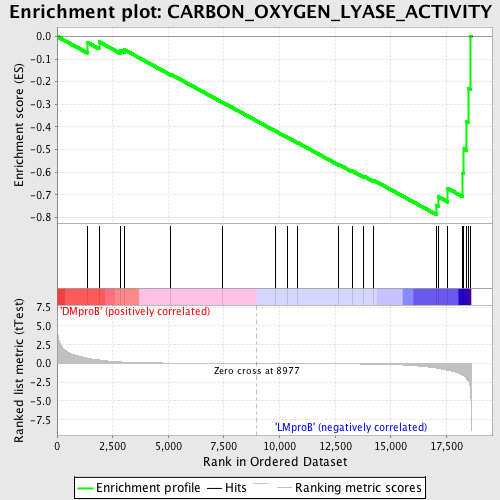
| GeneSet | CARBON_OXYGEN_LYASE_ACTIVITY |
| Enrichment Score (ES) | -0.78709066 |
| Normalized Enrichment Score (NES) | -1.6005036 |
| Nominal p-value | 0.010288066 |
| FDR q-value | 0.30075157 |
| FWER p-Value | 0.889 |
| PROBE | DESCRIPTION (from dataset) | GENE SYMBOL | GENE_TITLE | RANK IN GENE LIST | RANK METRIC SCORE | RUNNING ES | CORE ENRICHMENT | |
|---|---|---|---|---|---|---|---|---|
| 1 | ECH1 | 18316 | 1360 | 0.709 | -0.0262 | No | ||
| 2 | CA1 | 8689 | 1884 | 0.466 | -0.0234 | No | ||
| 3 | ACO1 | 16244 | 2844 | 0.207 | -0.0613 | No | ||
| 4 | EHHADH | 22635 | 3023 | 0.184 | -0.0587 | No | ||
| 5 | ECHS1 | 17573 | 5110 | 0.056 | -0.1672 | No | ||
| 6 | ENO2 | 8904 | 7433 | 0.017 | -0.2909 | No | ||
| 7 | CBS | 1550 23034 | 9824 | -0.008 | -0.4189 | No | ||
| 8 | OGG1 | 17331 | 10363 | -0.014 | -0.4469 | No | ||
| 9 | CA4 | 20723 | 10820 | -0.019 | -0.4702 | No | ||
| 10 | AUH | 21464 | 12662 | -0.044 | -0.5662 | No | ||
| 11 | CA3 | 4476 8690 | 13259 | -0.057 | -0.5945 | No | ||
| 12 | HADHA | 16579 | 13768 | -0.073 | -0.6170 | No | ||
| 13 | ENO3 | 8905 | 14217 | -0.090 | -0.6352 | No | ||
| 14 | HADHB | 3514 10527 | 17043 | -0.607 | -0.7468 | Yes | ||
| 15 | NTHL1 | 23357 | 17128 | -0.645 | -0.7086 | Yes | ||
| 16 | PTS | 19126 | 17565 | -0.897 | -0.6726 | Yes | ||
| 17 | CA2 | 15631 1825 | 18236 | -1.577 | -0.6042 | Yes | ||
| 18 | ENO1 | 8903 | 18288 | -1.655 | -0.4972 | Yes | ||
| 19 | GMDS | 21496 | 18390 | -1.941 | -0.3741 | Yes | ||
| 20 | ALAD | 15866 | 18472 | -2.247 | -0.2296 | Yes | ||
| 21 | APEX1 | 22028 | 18588 | -3.582 | 0.0015 | Yes |