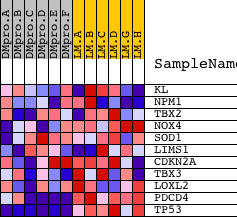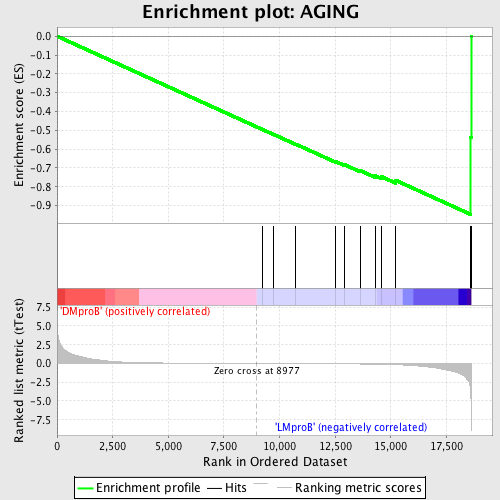
Profile of the Running ES Score & Positions of GeneSet Members on the Rank Ordered List
| Dataset | Set_04_DMproB_versus_LMproB.phenotype_DMproB_versus_LMproB.cls #DMproB_versus_LMproB |
| Phenotype | phenotype_DMproB_versus_LMproB.cls#DMproB_versus_LMproB |
| Upregulated in class | LMproB |
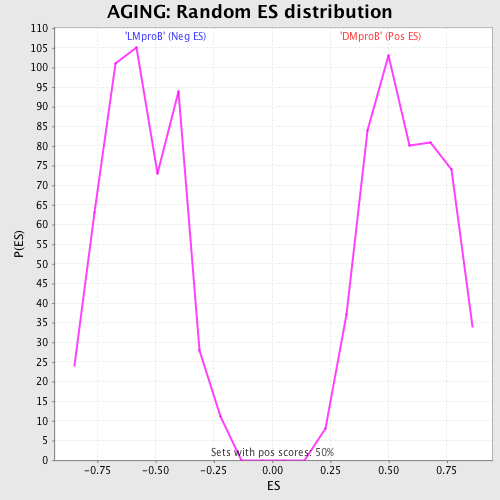
| GeneSet | AGING |
| Enrichment Score (ES) | -0.94743234 |
| Normalized Enrichment Score (NES) | -1.6826972 |
| Nominal p-value | 0.0 |
| FDR q-value | 0.10001164 |
| FWER p-Value | 0.376 |
| PROBE | DESCRIPTION (from dataset) | GENE SYMBOL | GENE_TITLE | RANK IN GENE LIST | RANK METRIC SCORE | RUNNING ES | CORE ENRICHMENT | |
|---|---|---|---|---|---|---|---|---|
| 1 | KL | 16611 | 9220 | -0.003 | -0.4953 | No | ||
| 2 | NPM1 | 1196 | 9722 | -0.007 | -0.5215 | No | ||
| 3 | TBX2 | 20720 | 10728 | -0.018 | -0.5738 | No | ||
| 4 | NOX4 | 18196 | 12532 | -0.042 | -0.6667 | No | ||
| 5 | SOD1 | 9846 | 12930 | -0.049 | -0.6834 | No | ||
| 6 | LIMS1 | 8493 4290 | 13636 | -0.068 | -0.7149 | No | ||
| 7 | CDKN2A | 2491 15841 | 14297 | -0.093 | -0.7415 | No | ||
| 8 | TBX3 | 16723 | 14574 | -0.108 | -0.7461 | No | ||
| 9 | LOXL2 | 8256 | 15228 | -0.156 | -0.7664 | Yes | ||
| 10 | PDCD4 | 5232 23816 | 18597 | -4.341 | -0.5357 | Yes | ||
| 11 | TP53 | 20822 | 18609 | -5.657 | 0.0004 | Yes |