Profile of the Running ES Score & Positions of GeneSet Members on the Rank Ordered List
| Dataset | Set_04_DMproB_versus_LMproB.phenotype_DMproB_versus_LMproB.cls #DMproB_versus_LMproB |
| Phenotype | phenotype_DMproB_versus_LMproB.cls#DMproB_versus_LMproB |
| Upregulated in class | LMproB |
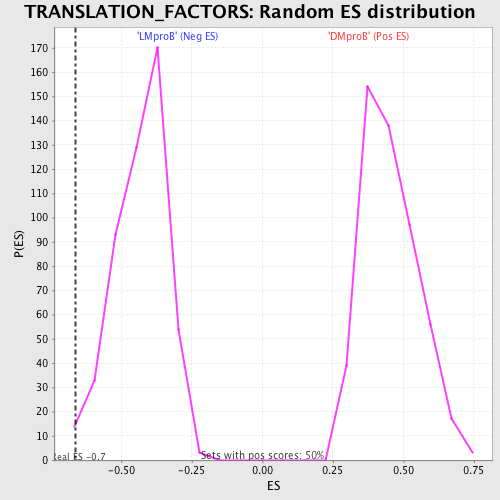
| GeneSet | TRANSLATION_FACTORS |
| Enrichment Score (ES) | -0.66164386 |
| Normalized Enrichment Score (NES) | -1.5369064 |
| Nominal p-value | 0.016129032 |
| FDR q-value | 0.47320014 |
| FWER p-Value | 0.945 |
| PROBE | DESCRIPTION (from dataset) | GENE SYMBOL | GENE_TITLE | RANK IN GENE LIST | RANK METRIC SCORE | RUNNING ES | CORE ENRICHMENT | |
|---|---|---|---|---|---|---|---|---|
| 1 | EIF4G3 | 10517 | 622 | 1.294 | 0.0112 | No | ||
| 2 | EIF2AK3 | 17421 | 642 | 1.270 | 0.0540 | No | ||
| 3 | EEF1D | 12393 2309 | 1173 | 0.828 | 0.0540 | No | ||
| 4 | EIF3S4 | 6588 11988 | 1454 | 0.649 | 0.0613 | No | ||
| 5 | EIF4G1 | 22818 | 1744 | 0.517 | 0.0636 | No | ||
| 6 | SLC35A4 | 12588 | 1910 | 0.455 | 0.0704 | No | ||
| 7 | EIF4EBP2 | 4662 | 1971 | 0.428 | 0.0820 | No | ||
| 8 | EIF4A1 | 8889 23719 | 2637 | 0.245 | 0.0546 | No | ||
| 9 | EIF2AK1 | 4869 | 4648 | 0.068 | -0.0512 | No | ||
| 10 | EIF1AY | 2643 24219 | 4733 | 0.066 | -0.0535 | No | ||
| 11 | EEF1A2 | 8880 14309 | 5285 | 0.052 | -0.0814 | No | ||
| 12 | GSPT2 | 4806 | 7019 | 0.022 | -0.1739 | No | ||
| 13 | EIF2S1 | 4658 | 9487 | -0.005 | -0.3066 | No | ||
| 14 | EIF5B | 10391 5963 | 10357 | -0.014 | -0.3529 | No | ||
| 15 | EIF3S9 | 16643 3528 | 12182 | -0.037 | -0.4498 | No | ||
| 16 | EIF4EBP1 | 8891 4661 | 12350 | -0.039 | -0.4574 | No | ||
| 17 | EIF4E | 15403 1827 8890 | 12531 | -0.042 | -0.4657 | No | ||
| 18 | EIF3S1 | 905 8114 | 14609 | -0.109 | -0.5737 | No | ||
| 19 | EIF3S3 | 12652 | 15018 | -0.137 | -0.5910 | No | ||
| 20 | EIF2B2 | 21204 | 15386 | -0.173 | -0.6047 | No | ||
| 21 | EEF2K | 18101 | 16444 | -0.384 | -0.6484 | Yes | ||
| 22 | EIF2B5 | 1719 22822 | 16476 | -0.390 | -0.6366 | Yes | ||
| 23 | EIF2B4 | 16574 | 16552 | -0.412 | -0.6264 | Yes | ||
| 24 | ITGB4BP | 9191 | 16563 | -0.417 | -0.6126 | Yes | ||
| 25 | EIF2B3 | 16118 | 16636 | -0.442 | -0.6012 | Yes | ||
| 26 | EIF2B1 | 16368 3458 | 16974 | -0.579 | -0.5994 | Yes | ||
| 27 | EIF3S5 | 18131 | 16996 | -0.586 | -0.5803 | Yes | ||
| 28 | EEF1G | 12480 | 17107 | -0.638 | -0.5642 | Yes | ||
| 29 | EIF2AK2 | 22892 | 17360 | -0.776 | -0.5510 | Yes | ||
| 30 | PAIP1 | 21556 | 17606 | -0.929 | -0.5321 | Yes | ||
| 31 | EIF3S6 | 4924 | 17651 | -0.966 | -0.5012 | Yes | ||
| 32 | EIF4A2 | 4660 1679 1645 | 17704 | -0.997 | -0.4696 | Yes | ||
| 33 | PABPC1 | 5219 9522 9523 23572 | 17721 | -1.001 | -0.4359 | Yes | ||
| 34 | EIF3S10 | 4659 8887 | 17729 | -1.005 | -0.4016 | Yes | ||
| 35 | EIF3S2 | 15744 2342 2478 | 17773 | -1.030 | -0.3684 | Yes | ||
| 36 | ETF1 | 23467 | 17789 | -1.041 | -0.3333 | Yes | ||
| 37 | EIF3S7 | 22226 | 17868 | -1.093 | -0.2998 | Yes | ||
| 38 | EIF3S8 | 7099 12100 | 18009 | -1.219 | -0.2653 | Yes | ||
| 39 | EEF2 | 8881 4654 8882 | 18034 | -1.249 | -0.2235 | Yes | ||
| 40 | EEF1B2 | 4131 12063 | 18086 | -1.325 | -0.1805 | Yes | ||
| 41 | EIF2S2 | 7406 14383 | 18158 | -1.435 | -0.1348 | Yes | ||
| 42 | EIF5 | 5736 | 18257 | -1.593 | -0.0851 | Yes | ||
| 43 | EIF5A | 11345 20379 6590 | 18567 | -3.026 | 0.0026 | Yes |