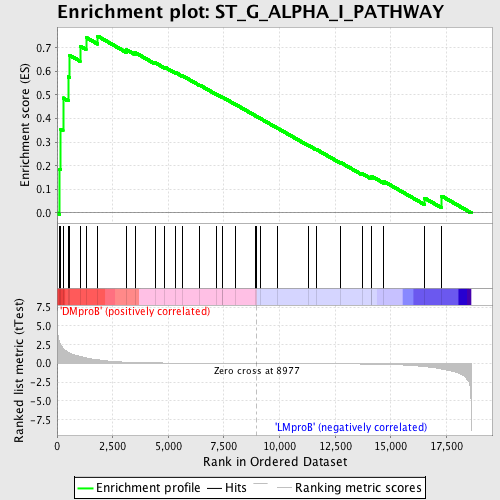
Profile of the Running ES Score & Positions of GeneSet Members on the Rank Ordered List
| Dataset | Set_04_DMproB_versus_LMproB.phenotype_DMproB_versus_LMproB.cls #DMproB_versus_LMproB |
| Phenotype | phenotype_DMproB_versus_LMproB.cls#DMproB_versus_LMproB |
| Upregulated in class | DMproB |
| GeneSet | ST_G_ALPHA_I_PATHWAY |
| Enrichment Score (ES) | 0.74928504 |
| Normalized Enrichment Score (NES) | 1.5983013 |
| Nominal p-value | 0.007858546 |
| FDR q-value | 0.18050037 |
| FWER p-Value | 0.645 |
| PROBE | DESCRIPTION (from dataset) | GENE SYMBOL | GENE_TITLE | RANK IN GENE LIST | RANK METRIC SCORE | RUNNING ES | CORE ENRICHMENT | |
|---|---|---|---|---|---|---|---|---|
| 1 | ITPR1 | 17341 | 120 | 2.791 | 0.1852 | Yes | ||
| 2 | ITPR3 | 9195 | 166 | 2.502 | 0.3546 | Yes | ||
| 3 | STAT3 | 5525 9906 | 266 | 2.009 | 0.4872 | Yes | ||
| 4 | RAF1 | 17035 | 504 | 1.490 | 0.5768 | Yes | ||
| 5 | PIK3CB | 19030 | 569 | 1.378 | 0.6679 | Yes | ||
| 6 | GRB2 | 20149 | 1032 | 0.936 | 0.7073 | Yes | ||
| 7 | AKT3 | 13739 982 | 1301 | 0.740 | 0.7437 | Yes | ||
| 8 | TERF2IP | 12184 18463 7167 | 1824 | 0.490 | 0.7493 | Yes | ||
| 9 | ITPKA | 14898 | 3120 | 0.172 | 0.6914 | No | ||
| 10 | ASAH1 | 3835 3853 8630 | 3502 | 0.131 | 0.6799 | No | ||
| 11 | DRD2 | 19461 | 4401 | 0.077 | 0.6369 | No | ||
| 12 | ITPKB | 3963 14028 | 4838 | 0.063 | 0.6177 | No | ||
| 13 | SOS1 | 5476 | 5333 | 0.050 | 0.5946 | No | ||
| 14 | PLCB4 | 9586 | 5632 | 0.044 | 0.5816 | No | ||
| 15 | EGFR | 1329 20944 | 6413 | 0.030 | 0.5417 | No | ||
| 16 | AKT1 | 8568 | 7183 | 0.020 | 0.5017 | No | ||
| 17 | RGS20 | 4001 12202 | 7423 | 0.017 | 0.4900 | No | ||
| 18 | PLCB1 | 14832 2821 | 7434 | 0.017 | 0.4906 | No | ||
| 19 | KCNJ9 | 9210 | 8006 | 0.010 | 0.4606 | No | ||
| 20 | EPHB2 | 4675 2440 8910 | 8933 | 0.001 | 0.4108 | No | ||
| 21 | PLCB2 | 5262 | 8945 | 0.000 | 0.4103 | No | ||
| 22 | KCNJ3 | 4944 | 9162 | -0.002 | 0.3988 | No | ||
| 23 | AKT2 | 4365 4366 | 9915 | -0.009 | 0.3589 | No | ||
| 24 | PITX2 | 15424 1878 | 11281 | -0.024 | 0.2872 | No | ||
| 25 | KCNJ5 | 9209 | 11640 | -0.029 | 0.2699 | No | ||
| 26 | SRC | 5507 | 12732 | -0.046 | 0.2143 | No | ||
| 27 | SHC1 | 9813 9812 5430 | 13721 | -0.071 | 0.1660 | No | ||
| 28 | PLCB3 | 23799 | 14117 | -0.086 | 0.1507 | No | ||
| 29 | ITPR2 | 9194 | 14123 | -0.086 | 0.1563 | No | ||
| 30 | SOS2 | 21049 | 14684 | -0.113 | 0.1339 | No | ||
| 31 | DAG1 | 18996 8837 | 16519 | -0.402 | 0.0628 | No | ||
| 32 | MAPK1 | 1642 11167 | 17285 | -0.727 | 0.0716 | No |

