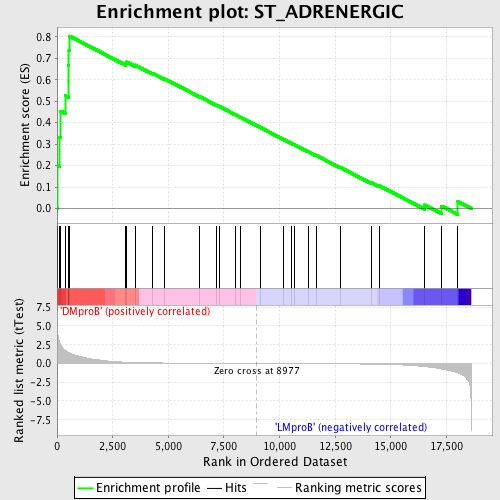
Profile of the Running ES Score & Positions of GeneSet Members on the Rank Ordered List
| Dataset | Set_04_DMproB_versus_LMproB.phenotype_DMproB_versus_LMproB.cls #DMproB_versus_LMproB |
| Phenotype | phenotype_DMproB_versus_LMproB.cls#DMproB_versus_LMproB |
| Upregulated in class | DMproB |
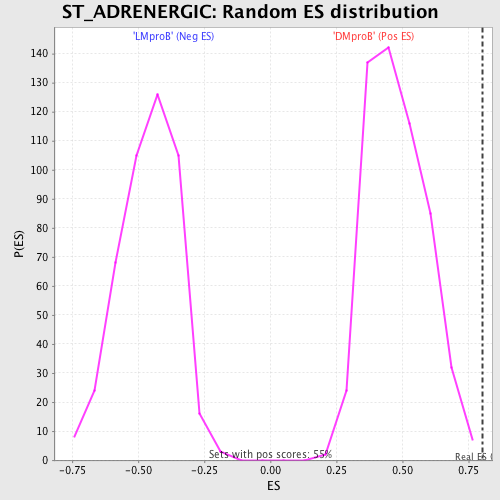
| GeneSet | ST_ADRENERGIC |
| Enrichment Score (ES) | 0.8032568 |
| Normalized Enrichment Score (NES) | 1.68161 |
| Nominal p-value | 0.0 |
| FDR q-value | 0.09384461 |
| FWER p-Value | 0.17 |
| PROBE | DESCRIPTION (from dataset) | GENE SYMBOL | GENE_TITLE | RANK IN GENE LIST | RANK METRIC SCORE | RUNNING ES | CORE ENRICHMENT | |
|---|---|---|---|---|---|---|---|---|
| 1 | CAMP | 18990 | 26 | 4.097 | 0.2003 | Yes | ||
| 2 | ITPR1 | 17341 | 120 | 2.791 | 0.3327 | Yes | ||
| 3 | ITPR3 | 9195 | 166 | 2.502 | 0.4534 | Yes | ||
| 4 | PHKA2 | 8471 24216 | 384 | 1.695 | 0.5251 | Yes | ||
| 5 | MAPK14 | 23313 | 503 | 1.495 | 0.5924 | Yes | ||
| 6 | RAF1 | 17035 | 504 | 1.490 | 0.6657 | Yes | ||
| 7 | GNA11 | 3300 3345 19670 | 532 | 1.456 | 0.7360 | Yes | ||
| 8 | GNA15 | 19671 | 561 | 1.398 | 0.8033 | Yes | ||
| 9 | GNAQ | 4786 23909 3685 | 3074 | 0.176 | 0.6768 | No | ||
| 10 | ITPKA | 14898 | 3120 | 0.172 | 0.6828 | No | ||
| 11 | ASAH1 | 3835 3853 8630 | 3502 | 0.131 | 0.6688 | No | ||
| 12 | MAPK10 | 11169 | 4286 | 0.082 | 0.6307 | No | ||
| 13 | ITPKB | 3963 14028 | 4838 | 0.063 | 0.6041 | No | ||
| 14 | EGFR | 1329 20944 | 6413 | 0.030 | 0.5209 | No | ||
| 15 | AKT1 | 8568 | 7183 | 0.020 | 0.4805 | No | ||
| 16 | PIK3R1 | 3170 | 7282 | 0.019 | 0.4762 | No | ||
| 17 | KCNJ9 | 9210 | 8006 | 0.010 | 0.4378 | No | ||
| 18 | PIK3CA | 9562 | 8241 | 0.008 | 0.4256 | No | ||
| 19 | KCNJ3 | 4944 | 9162 | -0.002 | 0.3762 | No | ||
| 20 | GNAI1 | 9024 | 10182 | -0.012 | 0.3219 | No | ||
| 21 | APC | 4396 2022 | 10515 | -0.015 | 0.3048 | No | ||
| 22 | PTX3 | 9668 15575 | 10657 | -0.017 | 0.2981 | No | ||
| 23 | PITX2 | 15424 1878 | 11281 | -0.024 | 0.2657 | No | ||
| 24 | KCNJ5 | 9209 | 11640 | -0.029 | 0.2479 | No | ||
| 25 | SRC | 5507 | 12732 | -0.046 | 0.1915 | No | ||
| 26 | ITPR2 | 9194 | 14123 | -0.086 | 0.1209 | No | ||
| 27 | AR | 24286 | 14470 | -0.102 | 0.1073 | No | ||
| 28 | DAG1 | 18996 8837 | 16519 | -0.402 | 0.0169 | No | ||
| 29 | MAPK1 | 1642 11167 | 17285 | -0.727 | 0.0115 | No | ||
| 30 | PIK3CD | 9563 | 18010 | -1.220 | 0.0326 | No |