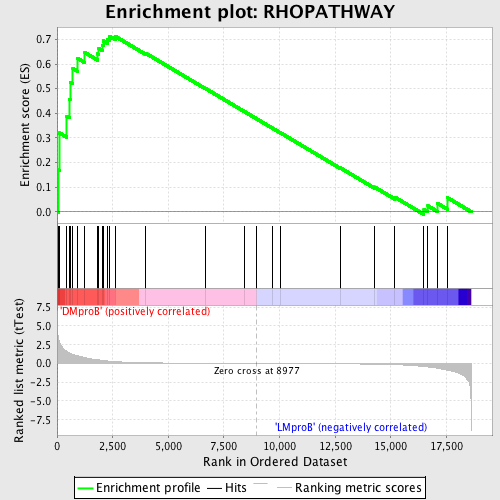
Profile of the Running ES Score & Positions of GeneSet Members on the Rank Ordered List
| Dataset | Set_04_DMproB_versus_LMproB.phenotype_DMproB_versus_LMproB.cls #DMproB_versus_LMproB |
| Phenotype | phenotype_DMproB_versus_LMproB.cls#DMproB_versus_LMproB |
| Upregulated in class | DMproB |
| GeneSet | RHOPATHWAY |
| Enrichment Score (ES) | 0.71322024 |
| Normalized Enrichment Score (NES) | 1.4693116 |
| Nominal p-value | 0.016363636 |
| FDR q-value | 0.4020142 |
| FWER p-Value | 0.999 |
| PROBE | DESCRIPTION (from dataset) | GENE SYMBOL | GENE_TITLE | RANK IN GENE LIST | RANK METRIC SCORE | RUNNING ES | CORE ENRICHMENT | |
|---|---|---|---|---|---|---|---|---|
| 1 | ARHGAP4 | 9343 | 67 | 3.297 | 0.1700 | Yes | ||
| 2 | MYLK | 22778 4213 | 107 | 2.894 | 0.3204 | Yes | ||
| 3 | ARPC1B | 3512 8628 | 436 | 1.610 | 0.3875 | Yes | ||
| 4 | VCL | 22083 | 549 | 1.419 | 0.4562 | Yes | ||
| 5 | ARPC3 | 12109 | 585 | 1.353 | 0.5256 | Yes | ||
| 6 | ARPC2 | 14225 | 709 | 1.187 | 0.5815 | Yes | ||
| 7 | ARHGEF1 | 1952 18343 3996 | 925 | 1.002 | 0.6227 | Yes | ||
| 8 | CFL1 | 4516 | 1247 | 0.780 | 0.6465 | Yes | ||
| 9 | TLN1 | 15899 | 1827 | 0.487 | 0.6410 | Yes | ||
| 10 | PIP5K1A | 23708 | 1874 | 0.470 | 0.6632 | Yes | ||
| 11 | ROCK1 | 5386 | 2041 | 0.402 | 0.6755 | Yes | ||
| 12 | MYL2 | 16713 | 2079 | 0.387 | 0.6939 | Yes | ||
| 13 | PIP5K1B | 5251 1841 | 2272 | 0.334 | 0.7011 | Yes | ||
| 14 | ARPC1A | 3541 16628 3519 | 2353 | 0.312 | 0.7132 | Yes | ||
| 15 | ARHGAP1 | 6001 10448 | 2619 | 0.248 | 0.7120 | No | ||
| 16 | BAIAP2 | 449 4236 | 3989 | 0.096 | 0.6435 | No | ||
| 17 | ARHGAP5 | 4412 8625 | 6658 | 0.027 | 0.5013 | No | ||
| 18 | ACTR2 | 20523 | 8401 | 0.006 | 0.4079 | No | ||
| 19 | ACTR3 | 13166 | 8962 | 0.000 | 0.3778 | No | ||
| 20 | LIMK1 | 16350 | 9664 | -0.007 | 0.3405 | No | ||
| 21 | ARHGAP6 | 24207 | 10039 | -0.010 | 0.3209 | No | ||
| 22 | SRC | 5507 | 12732 | -0.046 | 0.1785 | No | ||
| 23 | ARHGEF11 | 10028 | 14263 | -0.092 | 0.1010 | No | ||
| 24 | OPHN1 | 24102 | 15182 | -0.152 | 0.0596 | No | ||
| 25 | GSN | 2784 | 16488 | -0.392 | 0.0101 | No | ||
| 26 | ARHGEF5 | 12025 | 16666 | -0.453 | 0.0244 | No | ||
| 27 | PFN1 | 9555 | 17099 | -0.635 | 0.0346 | No | ||
| 28 | ARPC4 | 12642 | 17552 | -0.892 | 0.0572 | No |

