Profile of the Running ES Score & Positions of GeneSet Members on the Rank Ordered List
| Dataset | Set_04_DMproB_versus_LMproB.phenotype_DMproB_versus_LMproB.cls #DMproB_versus_LMproB |
| Phenotype | phenotype_DMproB_versus_LMproB.cls#DMproB_versus_LMproB |
| Upregulated in class | DMproB |
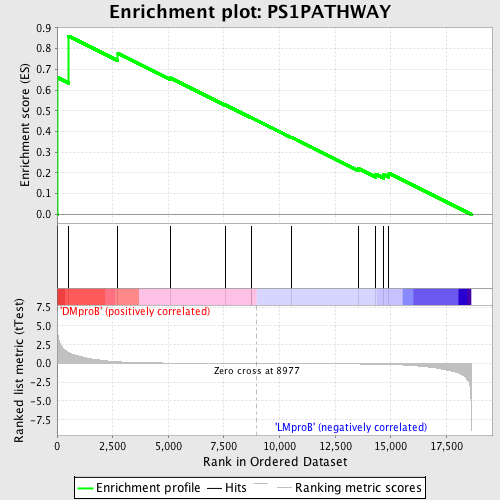
| GeneSet | PS1PATHWAY |
| Enrichment Score (ES) | 0.8604449 |
| Normalized Enrichment Score (NES) | 1.5258878 |
| Nominal p-value | 0.014084507 |
| FDR q-value | 0.28788257 |
| FWER p-Value | 0.967 |
| PROBE | DESCRIPTION (from dataset) | GENE SYMBOL | GENE_TITLE | RANK IN GENE LIST | RANK METRIC SCORE | RUNNING ES | CORE ENRICHMENT | |
|---|---|---|---|---|---|---|---|---|
| 1 | NOTCH1 | 14649 | 22 | 4.261 | 0.6598 | Yes | ||
| 2 | AXIN1 | 1579 23330 | 524 | 1.467 | 0.8604 | Yes | ||
| 3 | GSK3B | 22761 | 2734 | 0.225 | 0.7767 | No | ||
| 4 | PSEN1 | 5297 2125 9630 | 5097 | 0.056 | 0.6584 | No | ||
| 5 | WNT1 | 22371 | 7559 | 0.016 | 0.5285 | No | ||
| 6 | FZD1 | 16923 | 8725 | 0.003 | 0.4663 | No | ||
| 7 | TCF1 | 16416 | 8741 | 0.002 | 0.4659 | No | ||
| 8 | APC | 4396 2022 | 10515 | -0.015 | 0.3729 | No | ||
| 9 | ADAM17 | 4343 | 13552 | -0.065 | 0.2199 | No | ||
| 10 | DLL1 | 23119 | 14314 | -0.094 | 0.1936 | No | ||
| 11 | BTRC | 4459 | 14683 | -0.113 | 0.1913 | No | ||
| 12 | DVL1 | 2412 15960 | 14916 | -0.129 | 0.1989 | No |

