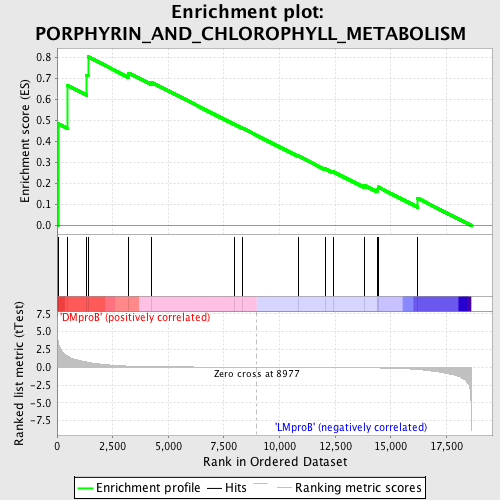
Profile of the Running ES Score & Positions of GeneSet Members on the Rank Ordered List
| Dataset | Set_04_DMproB_versus_LMproB.phenotype_DMproB_versus_LMproB.cls #DMproB_versus_LMproB |
| Phenotype | phenotype_DMproB_versus_LMproB.cls#DMproB_versus_LMproB |
| Upregulated in class | DMproB |
| GeneSet | PORPHYRIN_AND_CHLOROPHYLL_METABOLISM |
| Enrichment Score (ES) | 0.80107075 |
| Normalized Enrichment Score (NES) | 1.4830532 |
| Nominal p-value | 0.04696673 |
| FDR q-value | 0.36183622 |
| FWER p-Value | 0.997 |
| PROBE | DESCRIPTION (from dataset) | GENE SYMBOL | GENE_TITLE | RANK IN GENE LIST | RANK METRIC SCORE | RUNNING ES | CORE ENRICHMENT | |
|---|---|---|---|---|---|---|---|---|
| 1 | UGT1A10 | 6908 | 40 | 3.716 | 0.4844 | Yes | ||
| 2 | HMOX1 | 18565 | 468 | 1.556 | 0.6652 | Yes | ||
| 3 | UROS | 17588 1227 | 1326 | 0.726 | 0.7142 | Yes | ||
| 4 | BLVRB | 18328 | 1393 | 0.691 | 0.8011 | Yes | ||
| 5 | HMBS | 19149 3004 49 | 3212 | 0.160 | 0.7243 | No | ||
| 6 | HMOX2 | 22871 | 4251 | 0.083 | 0.6794 | No | ||
| 7 | CPOX | 1740 8780 | 7991 | 0.011 | 0.4798 | No | ||
| 8 | EPRS | 14014 | 8319 | 0.007 | 0.4631 | No | ||
| 9 | HCCS | 9079 4842 | 10835 | -0.019 | 0.3304 | No | ||
| 10 | PPOX | 13761 4104 | 12062 | -0.035 | 0.2690 | No | ||
| 11 | UROD | 15791 | 12402 | -0.040 | 0.2561 | No | ||
| 12 | UGT1A6 | 3969 4079 6911 13591 | 13815 | -0.075 | 0.1900 | No | ||
| 13 | FECH | 1975 23419 1964 | 14383 | -0.097 | 0.1722 | No | ||
| 14 | CP | 4555 | 14423 | -0.099 | 0.1831 | No | ||
| 15 | BLVRA | 14868 | 16212 | -0.322 | 0.1292 | No |

