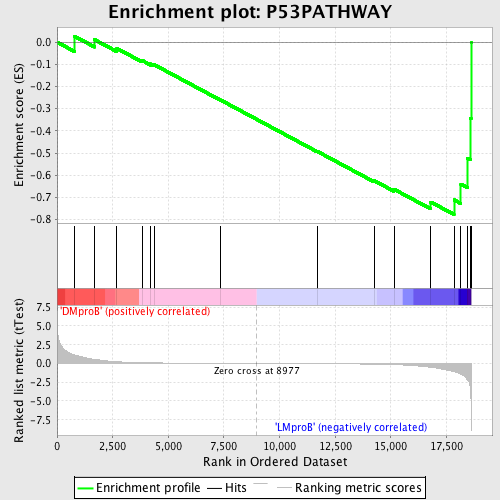
Profile of the Running ES Score & Positions of GeneSet Members on the Rank Ordered List
| Dataset | Set_04_DMproB_versus_LMproB.phenotype_DMproB_versus_LMproB.cls #DMproB_versus_LMproB |
| Phenotype | phenotype_DMproB_versus_LMproB.cls#DMproB_versus_LMproB |
| Upregulated in class | LMproB |
| GeneSet | P53PATHWAY |
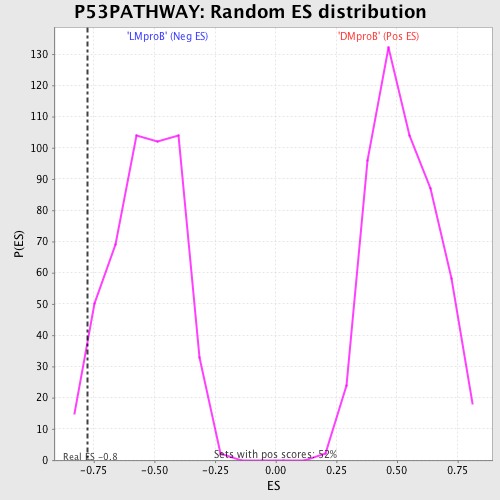
| Enrichment Score (ES) | -0.7769866 |
| Normalized Enrichment Score (NES) | -1.4513243 |
| Nominal p-value | 0.03966597 |
| FDR q-value | 0.734221 |
| FWER p-Value | 0.999 |
| PROBE | DESCRIPTION (from dataset) | GENE SYMBOL | GENE_TITLE | RANK IN GENE LIST | RANK METRIC SCORE | RUNNING ES | CORE ENRICHMENT | |
|---|---|---|---|---|---|---|---|---|
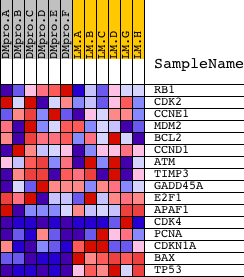
| 1 | RB1 | 21754 | 770 | 1.125 | 0.0274 | No | ||
| 2 | CDK2 | 3438 3373 19592 3322 | 1686 | 0.541 | 0.0113 | No | ||
| 3 | CCNE1 | 17857 | 2685 | 0.235 | -0.0280 | No | ||
| 4 | MDM2 | 19620 3327 | 3820 | 0.107 | -0.0824 | No | ||
| 5 | BCL2 | 8651 3928 13864 4435 981 4062 13863 4027 | 4210 | 0.085 | -0.0981 | No | ||
| 6 | CCND1 | 4487 4488 8707 17535 | 4372 | 0.079 | -0.1019 | No | ||
| 7 | ATM | 2976 19115 | 7356 | 0.018 | -0.2612 | No | ||
| 8 | TIMP3 | 10179 5758 | 11707 | -0.030 | -0.4932 | No | ||
| 9 | GADD45A | 17129 | 14250 | -0.091 | -0.6243 | No | ||
| 10 | E2F1 | 14384 | 15142 | -0.148 | -0.6632 | No | ||
| 11 | APAF1 | 8606 | 16795 | -0.511 | -0.7208 | Yes | ||
| 12 | CDK4 | 3424 19859 | 17842 | -1.076 | -0.7112 | Yes | ||
| 13 | PCNA | 9535 | 18149 | -1.424 | -0.6406 | Yes | ||
| 14 | CDKN1A | 4511 8729 | 18443 | -2.164 | -0.5240 | Yes | ||
| 15 | BAX | 17832 | 18570 | -3.065 | -0.3434 | Yes | ||
| 16 | TP53 | 20822 | 18609 | -5.657 | 0.0004 | Yes |