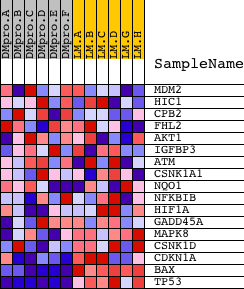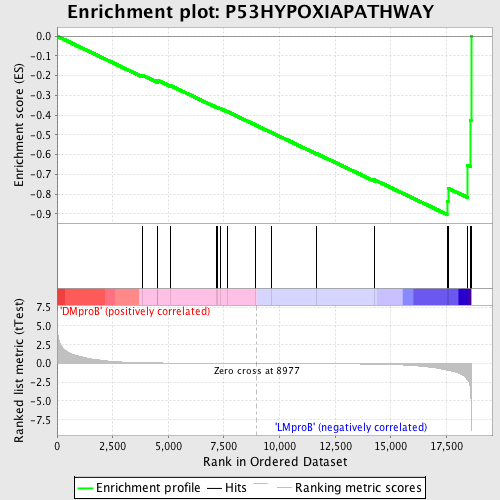
Profile of the Running ES Score & Positions of GeneSet Members on the Rank Ordered List
| Dataset | Set_04_DMproB_versus_LMproB.phenotype_DMproB_versus_LMproB.cls #DMproB_versus_LMproB |
| Phenotype | phenotype_DMproB_versus_LMproB.cls#DMproB_versus_LMproB |
| Upregulated in class | LMproB |
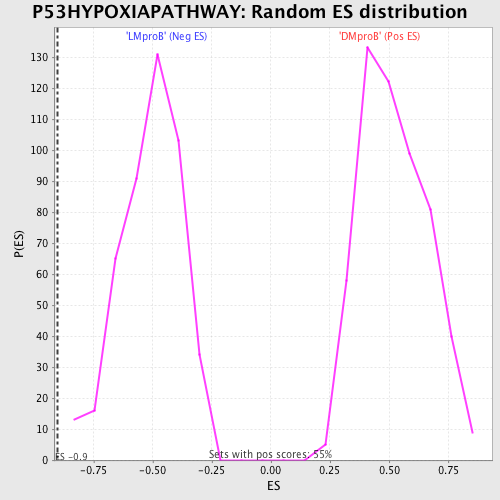
| GeneSet | P53HYPOXIAPATHWAY |
| Enrichment Score (ES) | -0.9030791 |
| Normalized Enrichment Score (NES) | -1.7792765 |
| Nominal p-value | 0.0 |
| FDR q-value | 0.0127295805 |
| FWER p-Value | 0.013 |
| PROBE | DESCRIPTION (from dataset) | GENE SYMBOL | GENE_TITLE | RANK IN GENE LIST | RANK METRIC SCORE | RUNNING ES | CORE ENRICHMENT | |
|---|---|---|---|---|---|---|---|---|
| 1 | MDM2 | 19620 3327 | 3820 | 0.107 | -0.1972 | No | ||
| 2 | HIC1 | 20350 | 4521 | 0.073 | -0.2293 | No | ||
| 3 | CPB2 | 21958 2894 3525 | 4524 | 0.073 | -0.2239 | No | ||
| 4 | FHL2 | 13966 | 5091 | 0.056 | -0.2500 | No | ||
| 5 | AKT1 | 8568 | 7183 | 0.020 | -0.3609 | No | ||
| 6 | IGFBP3 | 4898 | 7198 | 0.020 | -0.3602 | No | ||
| 7 | ATM | 2976 19115 | 7356 | 0.018 | -0.3673 | No | ||
| 8 | CSNK1A1 | 8204 | 7661 | 0.014 | -0.3825 | No | ||
| 9 | NQO1 | 18754 3836 | 8903 | 0.001 | -0.4492 | No | ||
| 10 | NFKBIB | 17906 | 9614 | -0.006 | -0.4869 | No | ||
| 11 | HIF1A | 4850 | 11677 | -0.030 | -0.5955 | No | ||
| 12 | GADD45A | 17129 | 14250 | -0.091 | -0.7268 | No | ||
| 13 | MAPK8 | 6459 | 17529 | -0.879 | -0.8364 | Yes | ||
| 14 | CSNK1D | 4181 8352 1387 | 17573 | -0.903 | -0.7701 | Yes | ||
| 15 | CDKN1A | 4511 8729 | 18443 | -2.164 | -0.6526 | Yes | ||
| 16 | BAX | 17832 | 18570 | -3.065 | -0.4269 | Yes | ||
| 17 | TP53 | 20822 | 18609 | -5.657 | 0.0004 | Yes |