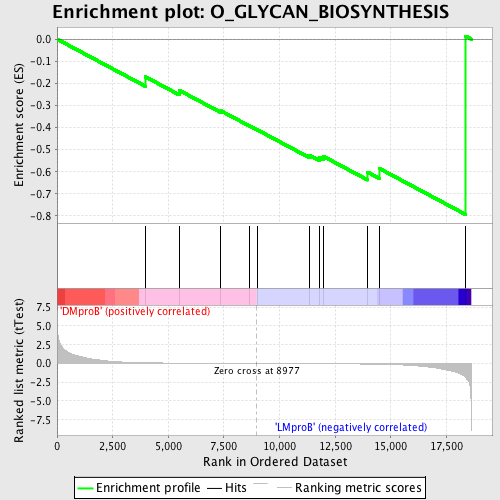
Profile of the Running ES Score & Positions of GeneSet Members on the Rank Ordered List
| Dataset | Set_04_DMproB_versus_LMproB.phenotype_DMproB_versus_LMproB.cls #DMproB_versus_LMproB |
| Phenotype | phenotype_DMproB_versus_LMproB.cls#DMproB_versus_LMproB |
| Upregulated in class | LMproB |
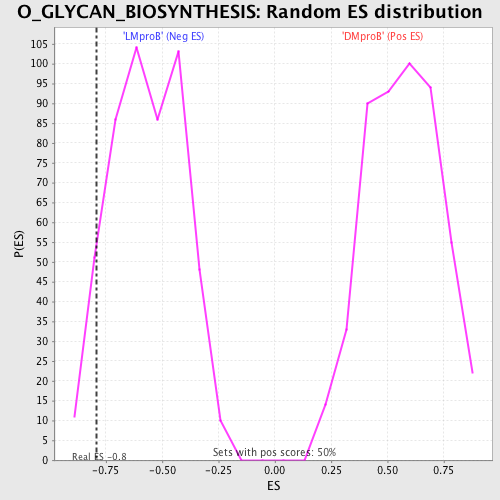
| GeneSet | O_GLYCAN_BIOSYNTHESIS |
| Enrichment Score (ES) | -0.7933026 |
| Normalized Enrichment Score (NES) | -1.4029682 |
| Nominal p-value | 0.0761523 |
| FDR q-value | 0.85718143 |
| FWER p-Value | 1.0 |
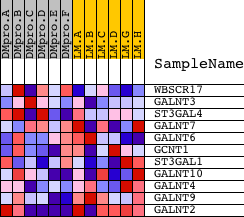
| PROBE | DESCRIPTION (from dataset) | GENE SYMBOL | GENE_TITLE | RANK IN GENE LIST | RANK METRIC SCORE | RUNNING ES | CORE ENRICHMENT | |
|---|---|---|---|---|---|---|---|---|
| 1 | WBSCR17 | 16357 | 3968 | 0.098 | -0.1702 | No | ||
| 2 | GALNT3 | 4751 | 5495 | 0.047 | -0.2317 | No | ||
| 3 | ST3GAL4 | 9816 | 7362 | 0.018 | -0.3242 | No | ||
| 4 | GALNT7 | 18870 | 8656 | 0.003 | -0.3922 | No | ||
| 5 | GALNT6 | 22126 | 9023 | -0.001 | -0.4117 | No | ||
| 6 | GCNT1 | 23715 3749 3689 | 11335 | -0.025 | -0.5248 | No | ||
| 7 | ST3GAL1 | 5435 2227 | 11791 | -0.031 | -0.5356 | No | ||
| 8 | GALNT10 | 9345 1269 | 11981 | -0.034 | -0.5309 | No | ||
| 9 | GALNT4 | 19892 | 13961 | -0.080 | -0.6021 | Yes | ||
| 10 | GALNT9 | 16753 | 14482 | -0.102 | -0.5850 | Yes | ||
| 11 | GALNT2 | 4239 18424 | 18359 | -1.834 | 0.0138 | Yes |