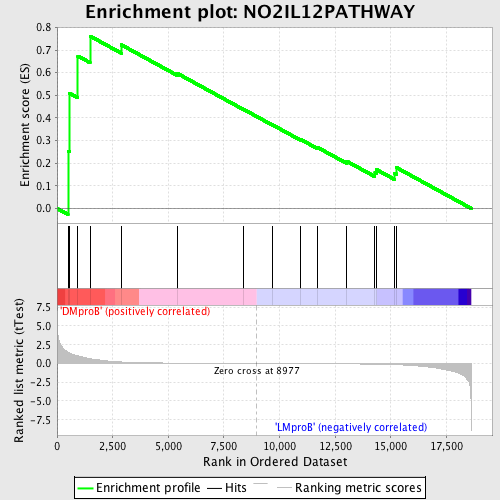
Profile of the Running ES Score & Positions of GeneSet Members on the Rank Ordered List
| Dataset | Set_04_DMproB_versus_LMproB.phenotype_DMproB_versus_LMproB.cls #DMproB_versus_LMproB |
| Phenotype | phenotype_DMproB_versus_LMproB.cls#DMproB_versus_LMproB |
| Upregulated in class | DMproB |
| GeneSet | NO2IL12PATHWAY |
| Enrichment Score (ES) | 0.7616916 |
| Normalized Enrichment Score (NES) | 1.4198571 |
| Nominal p-value | 0.066 |
| FDR q-value | 0.5998419 |
| FWER p-Value | 1.0 |
| PROBE | DESCRIPTION (from dataset) | GENE SYMBOL | GENE_TITLE | RANK IN GENE LIST | RANK METRIC SCORE | RUNNING ES | CORE ENRICHMENT | |
|---|---|---|---|---|---|---|---|---|
| 1 | IL12A | 4913 | 492 | 1.522 | 0.2540 | Yes | ||
| 2 | STAT4 | 14251 9907 | 557 | 1.405 | 0.5096 | Yes | ||
| 3 | CD3D | 19473 | 932 | 1.000 | 0.6738 | Yes | ||
| 4 | TYK2 | 12058 19215 | 1482 | 0.637 | 0.7617 | Yes | ||
| 5 | IL12RB1 | 3916 18582 | 2889 | 0.201 | 0.7231 | No | ||
| 6 | IL12RB2 | 17128 | 5412 | 0.049 | 0.5965 | No | ||
| 7 | CD3E | 8714 | 8370 | 0.006 | 0.4387 | No | ||
| 8 | IL12B | 20918 | 9683 | -0.007 | 0.3694 | No | ||
| 9 | CD3G | 19139 | 10934 | -0.020 | 0.3059 | No | ||
| 10 | JAK2 | 23893 9197 3706 | 11684 | -0.030 | 0.2711 | No | ||
| 11 | CCR5 | 8754 4534 | 13005 | -0.051 | 0.2095 | No | ||
| 12 | IFNG | 19869 | 14286 | -0.093 | 0.1579 | No | ||
| 13 | CD4 | 16999 | 14357 | -0.096 | 0.1718 | No | ||
| 14 | CD2 | 15223 | 15175 | -0.151 | 0.1557 | No | ||
| 15 | CXCR3 | 24093 | 15252 | -0.159 | 0.1808 | No |

