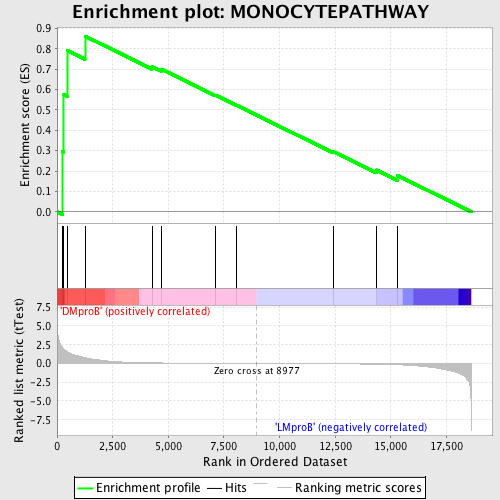
Profile of the Running ES Score & Positions of GeneSet Members on the Rank Ordered List
| Dataset | Set_04_DMproB_versus_LMproB.phenotype_DMproB_versus_LMproB.cls #DMproB_versus_LMproB |
| Phenotype | phenotype_DMproB_versus_LMproB.cls#DMproB_versus_LMproB |
| Upregulated in class | DMproB |
| GeneSet | MONOCYTEPATHWAY |
| Enrichment Score (ES) | 0.86251974 |
| Normalized Enrichment Score (NES) | 1.511388 |
| Nominal p-value | 0.007797271 |
| FDR q-value | 0.2837148 |
| FWER p-Value | 0.979 |
| PROBE | DESCRIPTION (from dataset) | GENE SYMBOL | GENE_TITLE | RANK IN GENE LIST | RANK METRIC SCORE | RUNNING ES | CORE ENRICHMENT | |
|---|---|---|---|---|---|---|---|---|
| 1 | SELL | 9798 | 244 | 2.106 | 0.2954 | Yes | ||
| 2 | ITGAL | 9187 | 304 | 1.928 | 0.5747 | Yes | ||
| 3 | ITGB1 | 3872 18411 | 482 | 1.537 | 0.7904 | Yes | ||
| 4 | ITGB2 | 19978 | 1254 | 0.775 | 0.8625 | Yes | ||
| 5 | SELP | 14073 | 4265 | 0.083 | 0.7129 | No | ||
| 6 | ITGAM | 9188 | 4686 | 0.067 | 0.7002 | No | ||
| 7 | SELE | 14074 | 7106 | 0.021 | 0.5732 | No | ||
| 8 | CD44 | 2881 2847 2893 4499 2724 | 8059 | 0.010 | 0.5235 | No | ||
| 9 | ITGA4 | 4929 | 12412 | -0.040 | 0.2955 | No | ||
| 10 | ICAM1 | 19545 | 14352 | -0.096 | 0.2053 | No | ||
| 11 | PECAM1 | 5239 | 15286 | -0.162 | 0.1790 | No |

