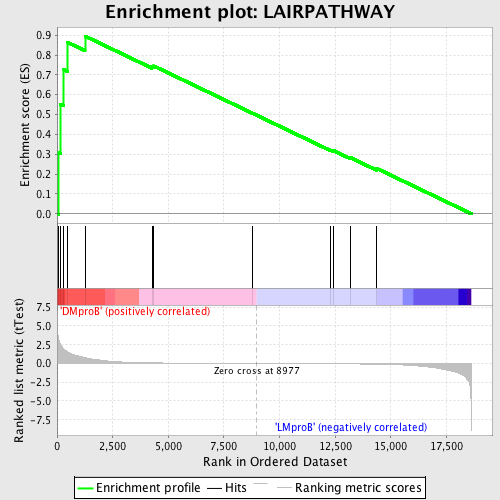
Profile of the Running ES Score & Positions of GeneSet Members on the Rank Ordered List
| Dataset | Set_04_DMproB_versus_LMproB.phenotype_DMproB_versus_LMproB.cls #DMproB_versus_LMproB |
| Phenotype | phenotype_DMproB_versus_LMproB.cls#DMproB_versus_LMproB |
| Upregulated in class | DMproB |
| GeneSet | LAIRPATHWAY |
| Enrichment Score (ES) | 0.89536595 |
| Normalized Enrichment Score (NES) | 1.5538293 |
| Nominal p-value | 0.0057803467 |
| FDR q-value | 0.28773248 |
| FWER p-Value | 0.902 |
| PROBE | DESCRIPTION (from dataset) | GENE SYMBOL | GENE_TITLE | RANK IN GENE LIST | RANK METRIC SCORE | RUNNING ES | CORE ENRICHMENT | |
|---|---|---|---|---|---|---|---|---|
| 1 | C3 | 22915 | 69 | 3.295 | 0.3094 | Yes | ||
| 2 | VCAM1 | 5851 | 148 | 2.595 | 0.5517 | Yes | ||
| 3 | ITGAL | 9187 | 304 | 1.928 | 0.7266 | Yes | ||
| 4 | ITGB1 | 3872 18411 | 482 | 1.537 | 0.8631 | Yes | ||
| 5 | ITGB2 | 19978 | 1254 | 0.775 | 0.8954 | Yes | ||
| 6 | SELP | 14073 | 4265 | 0.083 | 0.7415 | No | ||
| 7 | TNF | 23004 | 4343 | 0.080 | 0.7449 | No | ||
| 8 | IL6 | 16895 | 8787 | 0.002 | 0.5063 | No | ||
| 9 | IL1A | 4915 | 12300 | -0.038 | 0.3212 | No | ||
| 10 | ITGA4 | 4929 | 12412 | -0.040 | 0.3190 | No | ||
| 11 | C6 | 22522 8671 | 13185 | -0.055 | 0.2827 | No | ||
| 12 | ICAM1 | 19545 | 14352 | -0.096 | 0.2292 | No |

