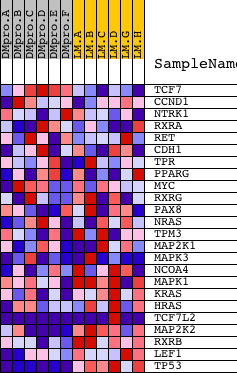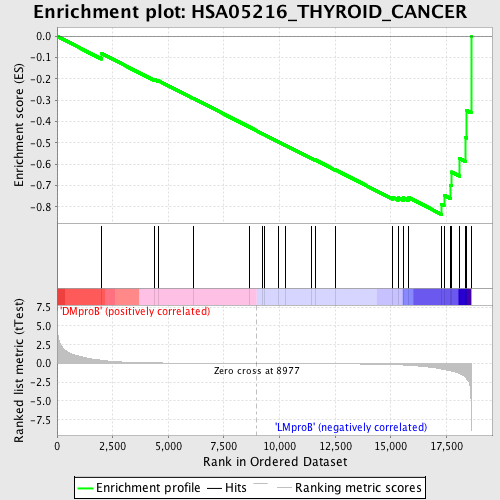
Profile of the Running ES Score & Positions of GeneSet Members on the Rank Ordered List
| Dataset | Set_04_DMproB_versus_LMproB.phenotype_DMproB_versus_LMproB.cls #DMproB_versus_LMproB |
| Phenotype | phenotype_DMproB_versus_LMproB.cls#DMproB_versus_LMproB |
| Upregulated in class | LMproB |
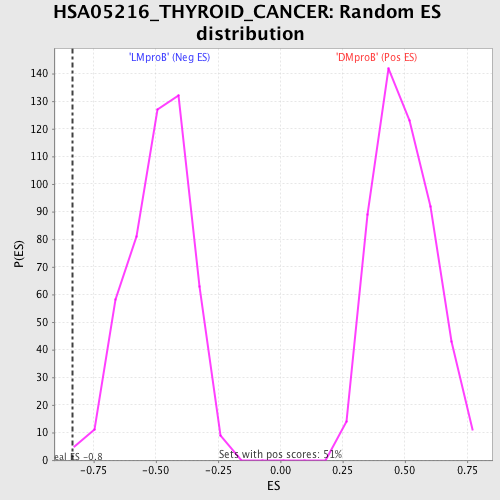
| GeneSet | HSA05216_THYROID_CANCER |
| Enrichment Score (ES) | -0.83528155 |
| Normalized Enrichment Score (NES) | -1.7219075 |
| Nominal p-value | 0.002057613 |
| FDR q-value | 0.03897156 |
| FWER p-Value | 0.078 |
| PROBE | DESCRIPTION (from dataset) | GENE SYMBOL | GENE_TITLE | RANK IN GENE LIST | RANK METRIC SCORE | RUNNING ES | CORE ENRICHMENT | |
|---|---|---|---|---|---|---|---|---|
| 1 | TCF7 | 1467 20466 | 1990 | 0.422 | -0.0802 | No | ||
| 2 | CCND1 | 4487 4488 8707 17535 | 4372 | 0.079 | -0.2033 | No | ||
| 3 | NTRK1 | 15299 | 4547 | 0.072 | -0.2081 | No | ||
| 4 | RXRA | 9767 | 6144 | 0.035 | -0.2917 | No | ||
| 5 | RET | 17028 | 8625 | 0.003 | -0.4249 | No | ||
| 6 | CDH1 | 18479 | 9229 | -0.003 | -0.4571 | No | ||
| 7 | TPR | 927 4255 | 9304 | -0.004 | -0.4609 | No | ||
| 8 | PPARG | 1151 1144 17319 | 9961 | -0.009 | -0.4956 | No | ||
| 9 | MYC | 22465 9435 | 10272 | -0.013 | -0.5115 | No | ||
| 10 | RXRG | 14063 | 11448 | -0.026 | -0.5730 | No | ||
| 11 | PAX8 | 2791 14671 | 11601 | -0.028 | -0.5793 | No | ||
| 12 | NRAS | 5191 | 12493 | -0.042 | -0.6246 | No | ||
| 13 | TPM3 | 12233 7209 7208 1790 | 15087 | -0.143 | -0.7550 | No | ||
| 14 | MAP2K1 | 19082 | 15326 | -0.166 | -0.7573 | No | ||
| 15 | MAPK3 | 6458 11170 | 15566 | -0.199 | -0.7575 | No | ||
| 16 | NCOA4 | 2746 6550 | 15782 | -0.230 | -0.7545 | No | ||
| 17 | MAPK1 | 1642 11167 | 17285 | -0.727 | -0.7891 | Yes | ||
| 18 | KRAS | 9247 | 17394 | -0.797 | -0.7444 | Yes | ||
| 19 | HRAS | 4868 | 17672 | -0.978 | -0.6972 | Yes | ||
| 20 | TCF7L2 | 10048 5646 | 17716 | -1.000 | -0.6361 | Yes | ||
| 21 | MAP2K2 | 19933 | 18076 | -1.311 | -0.5722 | Yes | ||
| 22 | RXRB | 23285 9768 | 18343 | -1.774 | -0.4740 | Yes | ||
| 23 | LEF1 | 1860 15420 | 18411 | -2.043 | -0.3480 | Yes | ||
| 24 | TP53 | 20822 | 18609 | -5.657 | 0.0004 | Yes |