Profile of the Running ES Score & Positions of GeneSet Members on the Rank Ordered List
| Dataset | Set_04_DMproB_versus_LMproB.phenotype_DMproB_versus_LMproB.cls #DMproB_versus_LMproB |
| Phenotype | phenotype_DMproB_versus_LMproB.cls#DMproB_versus_LMproB |
| Upregulated in class | DMproB |
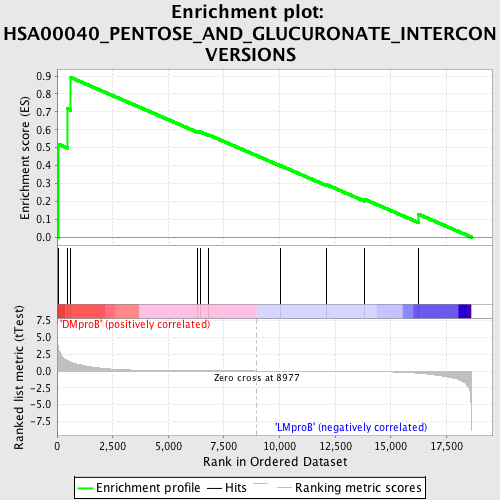
| GeneSet | HSA00040_PENTOSE_AND_GLUCURONATE_INTERCONVERSIONS |
| Enrichment Score (ES) | 0.8913771 |
| Normalized Enrichment Score (NES) | 1.5503393 |
| Nominal p-value | 0.003816794 |
| FDR q-value | 0.2714466 |
| FWER p-Value | 0.914 |
| PROBE | DESCRIPTION (from dataset) | GENE SYMBOL | GENE_TITLE | RANK IN GENE LIST | RANK METRIC SCORE | RUNNING ES | CORE ENRICHMENT | |
|---|---|---|---|---|---|---|---|---|
| 1 | UGT1A10 | 6908 | 40 | 3.716 | 0.5201 | Yes | ||
| 2 | UGT1A9 | 11849 11850 | 461 | 1.568 | 0.7179 | Yes | ||
| 3 | UGP2 | 20518 | 621 | 1.295 | 0.8914 | Yes | ||
| 4 | UGDH | 10249 | 6320 | 0.032 | 0.5896 | No | ||
| 5 | UGT1A1 | 11851 | 6423 | 0.030 | 0.5883 | No | ||
| 6 | XYLB | 19277 | 6817 | 0.024 | 0.5706 | No | ||
| 7 | RPE | 14232 | 10058 | -0.011 | 0.3980 | No | ||
| 8 | UGT2A1 | 8247 | 12090 | -0.035 | 0.2938 | No | ||
| 9 | UGT1A6 | 3969 4079 6911 13591 | 13815 | -0.075 | 0.2116 | No | ||
| 10 | DCXR | 20108 | 16245 | -0.330 | 0.1274 | No |

