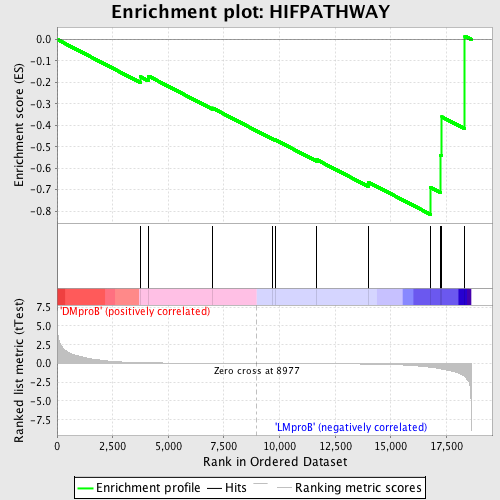
Profile of the Running ES Score & Positions of GeneSet Members on the Rank Ordered List
| Dataset | Set_04_DMproB_versus_LMproB.phenotype_DMproB_versus_LMproB.cls #DMproB_versus_LMproB |
| Phenotype | phenotype_DMproB_versus_LMproB.cls#DMproB_versus_LMproB |
| Upregulated in class | LMproB |
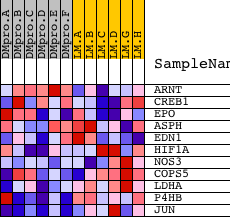
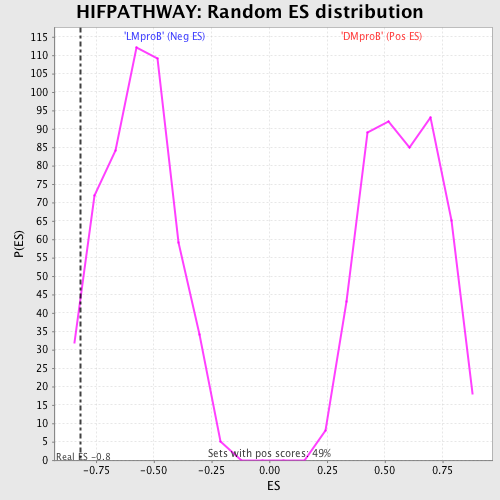
| GeneSet | HIFPATHWAY |
| Enrichment Score (ES) | -0.8154698 |
| Normalized Enrichment Score (NES) | -1.4291565 |
| Nominal p-value | 0.037475344 |
| FDR q-value | 0.77646 |
| FWER p-Value | 1.0 |
| PROBE | DESCRIPTION (from dataset) | GENE SYMBOL | GENE_TITLE | RANK IN GENE LIST | RANK METRIC SCORE | RUNNING ES | CORE ENRICHMENT | |
|---|---|---|---|---|---|---|---|---|
| 1 | ARNT | 4413 1857 | 3754 | 0.112 | -0.1742 | No | ||
| 2 | CREB1 | 3990 8782 4558 4093 | 4110 | 0.090 | -0.1709 | No | ||
| 3 | EPO | 8911 | 6977 | 0.022 | -0.3194 | No | ||
| 4 | ASPH | 2498 2460 2396 2370 2357 2502 2516 2375 2337 12276 2381 2454 7246 2480 2393 | 9693 | -0.007 | -0.4636 | No | ||
| 5 | EDN1 | 21658 | 9812 | -0.008 | -0.4680 | No | ||
| 6 | HIF1A | 4850 | 11677 | -0.030 | -0.5608 | No | ||
| 7 | NOS3 | 16906 885 | 13989 | -0.081 | -0.6650 | No | ||
| 8 | COPS5 | 4117 14002 | 16790 | -0.507 | -0.6903 | Yes | ||
| 9 | LDHA | 9269 | 17242 | -0.706 | -0.5400 | Yes | ||
| 10 | P4HB | 20115 | 17296 | -0.735 | -0.3611 | Yes | ||
| 11 | JUN | 15832 | 18330 | -1.748 | 0.0154 | Yes |