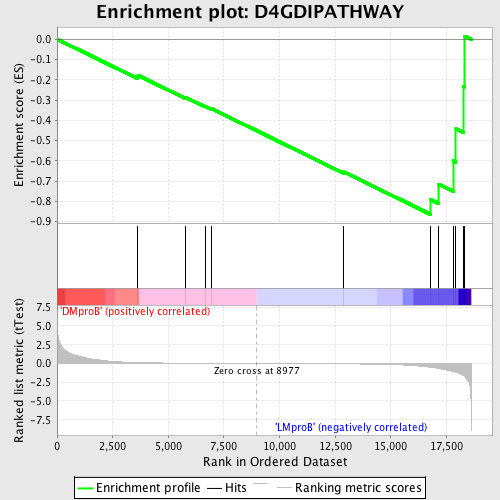
Profile of the Running ES Score & Positions of GeneSet Members on the Rank Ordered List
| Dataset | Set_04_DMproB_versus_LMproB.phenotype_DMproB_versus_LMproB.cls #DMproB_versus_LMproB |
| Phenotype | phenotype_DMproB_versus_LMproB.cls#DMproB_versus_LMproB |
| Upregulated in class | LMproB |
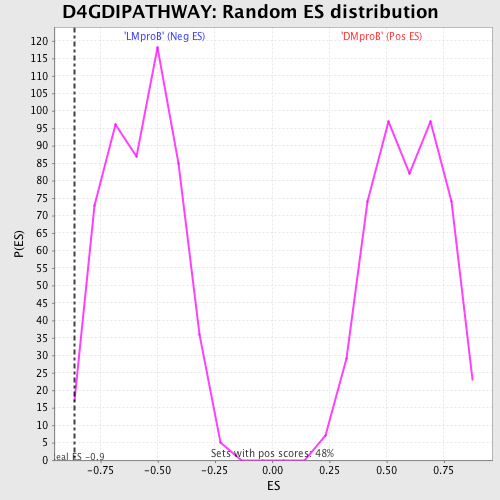
| GeneSet | D4GDIPATHWAY |
| Enrichment Score (ES) | -0.86516225 |
| Normalized Enrichment Score (NES) | -1.5172125 |
| Nominal p-value | 0.00967118 |
| FDR q-value | 0.529069 |
| FWER p-Value | 0.98 |
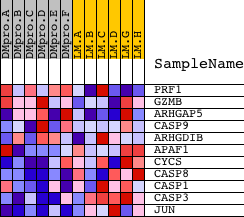
| PROBE | DESCRIPTION (from dataset) | GENE SYMBOL | GENE_TITLE | RANK IN GENE LIST | RANK METRIC SCORE | RUNNING ES | CORE ENRICHMENT | |
|---|---|---|---|---|---|---|---|---|
| 1 | PRF1 | 20011 | 3634 | 0.120 | -0.1781 | No | ||
| 2 | GZMB | 21810 | 5765 | 0.041 | -0.2866 | No | ||
| 3 | ARHGAP5 | 4412 8625 | 6658 | 0.027 | -0.3307 | No | ||
| 4 | CASP9 | 16001 2410 2458 | 6938 | 0.023 | -0.3424 | No | ||
| 5 | ARHGDIB | 16950 | 12865 | -0.048 | -0.6540 | No | ||
| 6 | APAF1 | 8606 | 16795 | -0.511 | -0.7917 | Yes | ||
| 7 | CYCS | 8821 | 17152 | -0.657 | -0.7163 | Yes | ||
| 8 | CASP8 | 8694 | 17804 | -1.050 | -0.6004 | Yes | ||
| 9 | CASP1 | 19577 | 17927 | -1.148 | -0.4419 | Yes | ||
| 10 | CASP3 | 8693 | 18250 | -1.583 | -0.2317 | Yes | ||
| 11 | JUN | 15832 | 18330 | -1.748 | 0.0154 | Yes |